| NASA | GSFC | JPL | Site Map |
|
||
 |
 |
Student Outcomes: Online Tools |
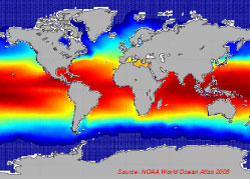
Spatial Patterns of Long-Term Mean Data
5-8: Water Cycle Explain the effect of temperature on density. 1f. Does salinity vary with depth?
1g. For these three locations, does temperature vary with depth?
1h. For these three locations, does density vary with depth?
1i. Compare profiles of salinity, temperature, and density with depth: which is the most consistent?
1k. What is the relationship between salinity, temperature, and density? (Q&A #1 pdf) EXTENSION ACTIVITY A Click on the Spatial Patterns tool.
Above "Interactive Map", toggle the radio button between Temperature and Density.
How are these maps related? EXTENSION ACTIVITY B Click on the Spatial Patterns tool.
Above "Interactive Map", click the Temperature radio button.
Click on one location in the ocean and hit Plot button below the map.
After the in-water profile is revealed at right, toggle the radio button between Temperature and Density
How are these in-water profiles related? Applicable Videos: Explain that the ocean holds a large amount of heat and the effect this has on climate. New "Q&A": How do ocean temperatures vary between winter and summer? How do they change from the surface to 300m depth? STEP 1: Compare Winter & Summer Temperatures at the Ocean Surface Click on the Spatial Patterns tool.
Above "Interactive Map", click on the "Temperature" radio button.
Below the map, use the pull-down menu labeled "Month" to change the month from "Jan" to "Jul" (do this several times). NOTE: The "Data Source" pull-down menu should be "Atlas" and "Depth (m)" should be "0").
(The "Data Source" pull-down menu should be "Atlas" and "Depth (m)" should be "0").
What is the difference between these maps? STEP 2: Compare Winter & Summer Temperatures at 300 Meters Depth As in Step 1, the "Temperature" radio button should be clicked above the "Interactive Map".
Below the map, use the pull-down menu labeled "Depth (m)" to change the depth from the surface (0m) to "300".
As in Step 1, use the pull-down menu labeled "Month" to change the month from "Jan" to "Jul" (do this several times).
What is the difference between these maps? STEP 3: Analysis Based on the seasonal temperature differences observed in Step 1 (sea surface), what can you conclude about the affect of surface ocean heat on climate in January and July? Based on the temperature differences observed in Step 2 (300m depth), what can you conclude about the affect of deep ocean heat on climate in January and July? Which of these two depths has a greater impact on land-based life and why? Applicable Videos: Explain the influence of ocean salinity on the thermohaline circulation (e.g., "global conveyor belt"). 6a. Are there connections between surface and deep ocean?
6b. Is deep ocean circulation part of the so-called "Global Conveyer Belt"?
6c. Does the "Global Conveyer Belt" play a role in the oceans? (Q&A #6 pdf) Applicable Videos: | |||||||||||||||||||||||