Click
here to search for other assets
Sea Surface DensityGrade levels: 5-8, 9-12
Themes:
ocean circulation,
water cycleVideo:
density_reverse_direction.flv
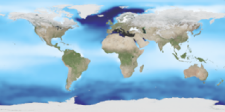
The average density of sea surface water can be calculated from the average sea surface temperature and salinity using the state equation for seawater. This animation shows the long term average sea surface density, with light blue regions having the least density and dark blue regions having the greatest density. The sea surface density variations are actually very small, less than 3 percent overall, but the variation is very important.
There are three stable, dense regions in the ocean's surface, one in the sea around Iceland, Greenland, and Scandinavia and the other two near or under major Antarctic ice shelves. In these regions, the surface water becomes dense enough to sink and join the deep ocean currents. In fact, this sinking is thought to drive these deep currents as part of a system called the
Thermohaline Circulation. This circulation has a strong effect on the Earth's climate, influencing the Gulf Stream, El Niño events, and both past and future climate shifts.
(source)
Student Outcomes
After viewing this video, students should be able to:
Explain the effect of density on ocean circulation. (O: 5-8)
Explain the influence of ocean salinity on the thermohaline circulation (e.g., "global conveyor belt"). (O: 9-12)
Explain the effect of temperature on density. (W: 5-8)
Key: C = climate / O = ocean circulation / T = 21st century technology / W = water cycle