Click
here to search for other assets
Sea Surface TemperatureGrade level: 5-8
Theme:
ocean circulationVideo:
sst_reverse_direction.flv
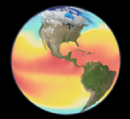
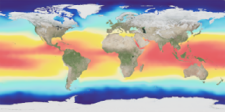
The oceans of the world are heated at the surface by the sun, and this heating is uneven for many reasons. The Earth's axial rotation, revolution about the sun, and tilt all play a role, as do the wind-driven ocean surface currents.
This animation shows the long-term average sea surface temperature, with red and yellow depicting warmer waters and blue depicting colder waters. The most obvious feature of this temperature map is the variation of the temperature by latitude, from the warm region along the equator to the cold regions near the poles. Another visible feature is the cooler regions just off the western coasts of North America, South America, and Africa. On these coasts, winds blow from land to ocean and push the warm water away from the coast, allowing cooler water to rise up from deeper in the ocean.
(source)
Student Outcomes
After viewing this video, students should be able to:
Explain the effect of solar energy heat on ocean circulation. (O: 5-8)
Key: C = climate / O = ocean circulation / T = 21st century technology / W = water cycle