Click
here to search for other assets
Sea Surface SalinityGrade level: 9-12
Theme:
ocean circulationVideo:
sss_reverse_direction.flv
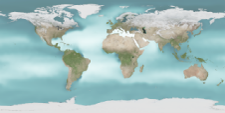
The heat of the sun forces evaporation at the ocean's surface, which puts water vapor into the atmosphere but leaves minerals and salts behind, keeping the ocean salty. The salinity of the ocean also varies from place to place, because evaporation varies based on the sea surface temperature and wind, rivers and rain storms inject fresh water into the ocean, and melting or freezing sea ice affects the salinity of polar waters.
This animation shows the long term average sea surface salinity, where white regions have the highest salinity and dark regions the lowest. Notice the higher salinity in the Atlantic, due partly to salty water coming from the Mediterranean, and the lower salinity at the mouths of major rivers.
(source)
Student Outcomes
After viewing this video, students should be able to:
Explain the influence of ocean salinity on the thermohaline circulation (e.g., "global conveyor belt"). (O: 9-12)
Key: C = climate / O = ocean circulation / T = 21st century technology / W = water cycle