| NASA | GSFC | JPL | Site Map |
|
||
 |
 |
Education: Student Outcomes |
Filtered by outcome, asset type: 9-12q3, tool Click here to begin a new search | |||||||||
Outcome: Explain the influence of the El Niño Southern Oscillation on global weather patterns. | |||||||||
Grade level: 9-12 Theme: ocean circulation Tool: http://mynasadata.larc.nasa.gov/preview_lesson.php?&passid=68
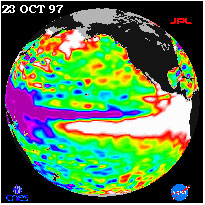
It is believed that El Niños occur every two to eight years, and are sometimes stronger, sometimes weaker. This often happens when the southeast trade winds weaken or even reverse. As a result, large masses of water from the western Pacific Ocean migrate to the east to the coast of South America. This change in ocean circulation not only impacts the weather and climate in South America, but also affects locations all around the globe. These effects can last for about a year, when the opposite conditions occur as the trade winds strengthen again, and the waters off the coast of South America are colder than normal from active upwelling occurring along the coast. This phase of the global circulation disruption is called La Niña. We have been fortunate over the last 30 years to have satellite and buoy data to warn us if the El Niño phase is upon us. By measuring sea surface heights with satellites like TOPEX Poseidon, sea surface temperature with satellites like AVHRR, and wind vectors from buoys and satellites, we can monitor the Pacific Ocean for changes that may signal the onset of El Niño or La Niña. The sensitive altimeter on the TOPEX Poseidon satellite can measure small changes that create hills and valleys on the sea surface which is mostly caused by thermal expansion (steric effect), and the warming of the ocean during an El Niño event can be sensed by the altimeter. This lesson explores El Niño by looking at sea surface temperature, sea surface height, and wind vectors in order to seek out any correlations there may be among these three variables. It employs group work where different teams work together to analyze a single variable, and then get together in different groups to compare all three variables. The lesson will guide students through data representing the strong El Niño from 1997 to 1998. By doing this, students will model the methods of researchers who bring their expertise to study integrated science questions. Depending on the classroom dynamics, available technology, and available time, this lesson may be modified. | |||||||||