| NASA | GSFC | JPL | Site Map |
|
||
 |
 |
Education: Student Outcomes |
Filtered by outcome: 5-8q4 Click here to begin a new search | |||||||||||||||||||||||||||||||||||||||||||||||||||||||||||||||||||||||||||||||||||||||||||||||||||||||||||||
Outcome: Explain the effect of density on ocean circulation. | |||||||||||||||||||||||||||||||||||||||||||||||||||||||||||||||||||||||||||||||||||||||||||||||||||||||||||||
Grade level: 5-8 Theme: ocean circulation Flat Tool: http://ourocean.jpl.nasa.gov/AQUARIUS/chp2.jsp GoogleEarth Interface Tool: http://aquarius.jpl.nasa.gov/AQUARIUS_DEV/chp2.jsp Create global maps of mean conditions for any month at designated depths (down to 1500m) using the pull-down menus. Monthly time-series graphs of salinity, temperature, or density can be plotted by selecting up to six locations (by clicking on the map or typing latitude/latitude information into the fields below). These time-series graphs can also represent up to six different depths. Plotted data will also be shown in a table that is easily downloaded (e.g., into Excel). Sources include interpolated atlas data or actual measurements from the database. Focus Questions | Flat Tool Tutorial Grade level: 5-8 Theme: ocean circulation Video: density_effects.flv
But in the ocean it often happens that the reverse happens: so we might get something that's heavy, heavier (like) more dense waters on top of lighter water. And when that happens, we say that the ocean is unstable and we have "overturning". That means that the waters that are heavy come down to the bottom part of the ocean and those that are light need to go up. And that happens when waters are cooled and it also happens when the upper waters get saltier because of evaporation, etc. So those density differences mean that the ocean is going to circulate: it's going to move. And those density differences can come about because of temperature changes or salinity changes. Grade level: 5-8 Theme: ocean circulation Activity: http://aquarius.nasa.gov/seawater_mix_sink.html Big Idea Two of the most important characteristics of ocean water are its temperature and salinity. Together they help govern the density of seawater, which is a major factor controlling the ocean's vertical movements and layered circulation. Key Concepts Sea water has characteristic properties (e.g. density) that are independent of sample size.
There are two main factors that make ocean water more or less dense: temperature and salinity.
Cold, salty water is denser than warm, fresher water and will sink below the less dense layer.
Density is defined as the measure of a material's mass (e.g. grams) divided by its volume (e.g. milliliters).
Mixing of seawater influences the density of seawater thereby affecting ocean circulation. Seawater mixing also has an effect on ocean life.
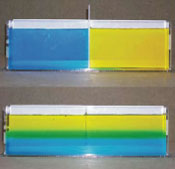
Background Density is weight divided by volume. The density of fresh water is 1 gram (mass) per cubic centimeter (volume). In other words, if you had a cube with the dimensions: 1cm x 1cm x 1cm; and filled it with pure water, that cube of water would weigh 1 gram. This density is expressed as 1 g/cm3. If you dissolve salt into the water, the salt will increase the fluid's mass, while its volume will remain the same. Thus, the liquid's density will increase. (more) Grade level: 5-8 Theme: ocean circulation Activity: http://www.tos.org/hands-on/teaching_phys_concepts.pdf
Stratification forms an effective barrier for the exchange of nutrients and dissolved gases between the top, illuminated surface layer where phytoplankton can thrive, and the deep, nutrientrich waters. Stratification therefore has important implications for biological and biogeochemical processes in the ocean. For example, periods of increased ocean stratification have been associated with decreases in surface phytoplankton biomass. In coastal waters, prolonged periods of stratification can lead to hypoxia (low oxygen), causing mortality of fish, crabs, and other marine organisms. This activity compares salt and fresh water, demonstrating that fluids arrange into layers according to their densities. Students in grades 9-12 should read the Background section (p. 4-5) of Chapter 1 (Density) in preparation for this activity. Videos
Flash Video | QuickTime MovieGrade level: 5-8 Theme: ocean circulation Video: salinity_importance.flv The salt in the ocean affects its density, just like the temperature affects its density. And the density, meaning the amount of mass per volume, is going to then impact how the ocean circulates, it's going to impact where the water goes as it circulates throughout the globe. Grade level: 5-8 Theme: ocean circulation Tool: http://oceanmotion.org/html/resources/oscar.htm This data visualizer gives access to the following global ocean surface current behaviors between 1992 and 2008: current speed, current direction, current convergence, and current vorticity as well as the anomaly values for each. Grade level: 5-8 Theme: ocean circulation Video: salt_of_earth_02.flv
Jeff Halverson: "It takes perhaps a thousand years for the water to cycle through the deep ocean. So we say the oceans have a memory. They're like a tape recorder. Things that happen now will still be manifest hundreds of years in the future as that cold water moves through this giant circulation." Susan Lozier: "So if there's any change to that overturning circulation, that means that Northern Europe and the British Isles would be robbed of that heat due to those waters that are returning to the high latitudes." (source) Grade level: 5-8 Theme: ocean circulation Video: salt_of_earth_01.flv
It's these differences in salinity that play a role in the processes that affect weather, climate, sea life, and the whole ocean system itself. And not all oceans have the same salinity. In fact, the North Atlantic Ocean tends to be the saltiest, much more than the Pacific. Susan Lozier: "The salt in the ocean affects its density, just like the temperature affects its density, and the density, meaning the amount mass per volume, is going to then impact where the water goes as it circulates throughout the globe." Jeff Halverson: "Differences in temperature and salt content of the water cause some areas of water to sink and some areas of water to rise. And so we tend to see the sinking water at the poles, the water rising back up at the equator, and if you connect the two together, what you have is an overturning that is deep in the ocean. It's like a big conveyor belt that operates in the ocean." This overturning moves warm water from the tropics toward the poles, and cold water from the poles toward the tropics. In this way the overturning regulates earth's climate. (source) Grade level: 5-8 Theme: ocean circulation Video: density_reverse_direction.flv
Grade level: 5-8 Theme: ocean circulation Video: thermohaline_conveyor_iPod.m4v.flv
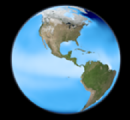
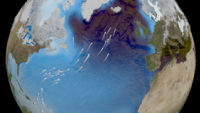
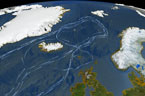
This animation shows one of the major regions where this pumping occurs: the North Atlantic Ocean around Greenland, Iceland, and the North Sea. The surface ocean current brings new water to this region from the South Atlantic via the Gulf Stream and the water returns to the South Atlantic via the North Atlantic Deep Water current. The continual influx of warm water into the North Atlantic polar ocean keeps the regions around Iceland and southern Greenland mostly free of sea ice year round. The animation also shows another feature of the global ocean circulation: the Antarctic Circumpolar Current. The region around latitude 60 degrees south is the the only part of the Earth where the ocean can flow all the way around the world with no land in the way. As a result, both the surface and deep waters flow from west to east around Antarctica. This circumpolar motion links the world's oceans and allows the deep water circulation from the Atlantic to rise in the Indian and Pacific Oceans and the surface circulation to close with the northward flow in the Atlantic. (source) Grade level: 5-8 Theme: ocean circulation Video: thermohaline_rev.flv
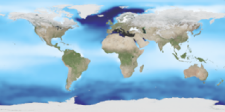
The animation also shows another feature of the global ocean circulation: the Antarctic Circumpolar Current. The region around latitude 60 south is the only part of the Earth where the ocean can flow all the way around the world with no obstruction by land. As a result, both the surface and deep waters flow from west to east around Antarctica. This circumpolar motion links the world's oceans and allows the deep water circulation from the Atlantic to rise in the Indian and Pacific Oceans, thereby closing the surface circulation with the northward flow in the Atlantic. The color on the world's ocean's at the beginning of this animation represents surface water density, with dark regions being most dense and light regions being least dense (see the animation Sea Surface Temperature, Salinity and Density). The depths of the oceans are highly exaggerated (100x in oceans, 20x on land) to better illustrate the differences between the surface flows and deep water flows. The actual flows in this model are based on current theories of the thermohaline circulation rather than actual data. The thermohaline circulation is a very slow moving current that can be difficult to distinguish from general ocean circulation. Therefore, it is difficult to measure or simulate. This version of the visualization combines the Earth look of the original thermohaline visualization with the new thermohaline flow field generated for the Science on a Sphere production, "Loop". (source) | |||||||||||||||||||||||||||||||||||||||||||||||||||||||||||||||||||||||||||||||||||||||||||||||||||||||||||||