| NASA | GSFC | JPL | Site Map |
|
||
 |
 |
Education: Student Outcomes |
Filtered by theme: 21st century technology Click here to begin a new search | ||||||||||||||||||||
Grade levels: K-4, 5-8, 9-12 Themes: 21st century technology, ocean circulation, water cycle Flat Tool: http://ourocean.jpl.nasa.gov/AQUARIUS/chp2.jsp GoogleEarth Interface Tool: http://aquarius.jpl.nasa.gov/AQUARIUS_DEV/chp2.jsp Create global maps of mean conditions for any month at designated depths (down to 1500m) using the pull-down menus. Monthly time-series graphs of salinity, temperature, or density can be plotted by selecting up to six locations (by clicking on the map or typing latitude/latitude information into the fields below). These time-series graphs can also represent up to six different depths. Plotted data will also be shown in a table that is easily downloaded (e.g., into Excel). Sources include interpolated atlas data or actual measurements from the database. Focus Questions | Flat Tool Tutorial | ||||||||||||||||||||
Grade level: 9-12 Theme: 21st century technology Video: aquarius_passive_satellilte.flv One thing to note about the Aquarius satellite is that it's what we call a "passive" satellite. Even though it takes a lot of work to get up there and a lot of people are working to put it up there, what it's doing is actually recording the wavelengths that the earth is radiating. So some satellites are "active": so they are sending a signal down through the atmosphere to earth's surface and then they are recording that signal that comes back. But when we're trying to measure the sea surface salinity, the Aquarius satellite will be recording the microwaves that the earth is sending back out to the atmosphere and space. | ||||||||||||||||||||
Grade level: 9-12 Theme: 21st century technology Video: argo07_640x480.flv
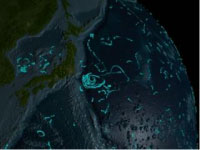
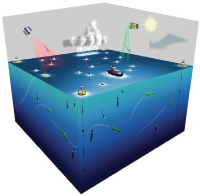
This visualization shows the locations of the ARGO buoy array over time. When the buoys are above water, the lines are brighter; when the buoys are under water, the lines are fainter. The ARGO buoys measure ocean salinity, column temperature, and current velocities. (source) | ||||||||||||||||||||
Grade levels: 5-8, 9-12 Themes: 21st century technology, climate, water cycle Flat Tool: http://ourocean.jpl.nasa.gov/AQUARIUS/chp3.jsp GoogleEarth Interface Tool: http://aquarius.jpl.nasa.gov/AQUARIUS_DEV/chp3.jsp Create global maps of mean conditions for any year(s) from 1800 to 2005 at designated depths (down to 1500m) using the pull-down menus. Annual time-series graphs of salinity, temperature, or density can be plotted by selecting up to six locations (by clicking on the map or typing latitude/latitude information into the fields below). These time-series graphs can also represent up to six different depths. Plotted data will also be shown in a table that is easily downloaded (e.g., into Excel). Source is actual, non-interpolated database measurements. Focus Questions | Flat Tool Tutorial | ||||||||||||||||||||
Grade levels: K-4, 9-12 Theme: 21st century technology Video: global_ocean_01.flv
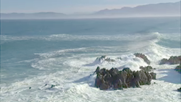
Paula Bontempi: "You can see the atmosphere, you can see the land, but you can't really see beneath the ocean's surface. So you start wondering, you know, what's going on beneath the part we can see." David Adamec: "We walk in a very small part of the atmosphere, and we walk on the land. And it's how that interaction takes place with the ocean, the atmosphere, and the land that determines our quality of life. Our goal is to understand the interconnectedness of it all." For years, people have worked to unravel the mysteries of the oceans. Scientists gather data from ships and buoys on the surface, take the plunge to explore ocean depths, and fly overhead to get a bigger picture. But one of the best views of oceans might be from way, way overhead. It's the view from space. Paula Bontempi: "The one thing that NASA satellites do that nothing else does, ships or buoys or anything else, is actually give you a picture of the globe within a few days. You get a much broader view of what's going on in some part of the Earth's system, and you can link that together to understand the Earth as a whole." | ||||||||||||||||||||
Grade level: 9-12 Theme: 21st century technology Video: global_ocean_02.flv
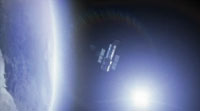
David Adamec: "We are dependent on life in the water. Especially in the ocean. There are small plants called phytoplankton that are responsible for 50 percent of the oxygen that you're breathing right now." | ||||||||||||||||||||
Grade level: K-4 Theme: 21st century technology Design your own experiment based on the activities conducted for the following outcomes:
| ||||||||||||||||||||
Grade level: 9-12 Theme: 21st century technology Design your own experiment based on the activities conducted for the following outcomes:
| ||||||||||||||||||||
Grade level: 5-8 Theme: 21st century technology Design your own experiment based on the activities conducted for the following outcomes:
| ||||||||||||||||||||
Grade level: 9-12 Theme: 21st century technology Video: aquarius_launch.flv Aquarius is going to be launched later this year. And one of the great things about it is that it has been in planning for a number of years and the launch is very exciting to all of those of us who have been working on it and looking forward to the launch. The main thing about it is that it is going to be giving us more data. So anybody who works in studying the oceans, the atmosphere, or the land on large scales is always interested in getting back more data. Because that just tells us a lot more about how the earth is working. | ||||||||||||||||||||
Grade level: 9-12 Theme: 21st century technology Video: getting_full_picture.flv Up until now when we've been trying to understand how density changes impact ocean circulation, we've really just had half the picture. Because we've just be able to look at our global coverage of temperature. But with the Aquarius mission, we'll be able to complete that other half. We'll be able to look at the salinity information; and the salinity combined with temperature will give us the information about the density field. | ||||||||||||||||||||
Grade level: 9-12 Theme: 21st century technology Video: how_aquarius_works.flv
But some of that energy comes back at wavelengths that are micro-wavelengths. And the microwave lengths - the amount of energy that's emitted by the ocean - depends on the salinity. It is related to something we call the "brightness temperature". It all has to do with how much energy is emitted from the ocean back to the atmosphere, back out to space. And so if a satellite is sitting there, it's actually recording how much energy in that microwave segment is being emitted. And by the signal that it receives, it's able to "back out" (i.e., calculate) what the ocean salinity is. | ||||||||||||||||||||
Grade level: 9-12 Theme: 21st century technology Video: aquarius_catch_up.flv
But with the ocean, the ocean has been much more inaccessible. It has been inaccessible because it's very far away from where people live, it's very deep, and it's also it's very salty which means it has been a very corrosive environment for instruments. But what we're able to do now with satellite measurements is get a lot of data over large areas of space and continuously in time. And that information about the salinity, coupled with the information we have about the ocean temperatures because of the NASA satellites, really helps us learn a lot more about the ocean, and the ocean circulation. So one day we will also be able to make predictions about ocean circulation. | ||||||||||||||||||||
Grade levels: 5-8, 9-12 Themes: 21st century technology, climate, ocean circulation, water cycle Flat Tool: http://ourocean.jpl.nasa.gov/AQUARIUS/chp1.jsp GoogleEarth Interface Tool: http://aquarius.jpl.nasa.gov/AQUARIUS_DEV/chp1.jsp Interactive maps of surface conditions can be clicked to create in-water profiles of salinity, temperature, or density. Sources include interpolated atlas data or actual measurements from the database. Focus Questions | Flat Tool Tutorial | ||||||||||||||||||||
Grade level: 9-12 Theme: 21st century technology Article: documents/21.1_lagerloef.pdf
Now, we are pleased to report that a new satellite program scheduled for launch in the near future will provide data to reveal how the ocean responds to the combined effects of evaporation, precipitation, ice melt, and river runoff on seasonal and interannual time scales. These measurements can be used, for example, to close the marine hydrologic budget, constrain coupled climate models, monitor mode water formation, investigate the upper-ocean response to precipitation variability in the tropical convergence zones, and provide early detection of low-salinity intrusions in the subpolar Atlantic and Southern oceans. Read and discuss the text on the Aquarius/SAC-D mission design (p. 73-74). | ||||||||||||||||||||
Grade level: 9-12 Theme: 21st century technology Article: documents/21.1_clivar.pdf
Read and discuss the Priority Recommendations section (p. 83-85). | ||||||||||||||||||||
Grade level: K-4 Theme: 21st century technology Video: http://ksnn.larc.nasa.gov/videos_cap.cfm?unit=studyspace
Some objects are too large to study well from the surface of the Earth. Again, hurricanes are a good example and so are earthquakes. Cracks in the Earth's crust, called faults, can cause earthquakes. Faults can be hundreds of miles long. Only satellites can see the entire fault at one time. Scientists and researchers around the world use NASA satellites. NASA's Earth Science Enterprise (ESE) and Earth Observing System (EOS) can study many natural hazards from space that can never be safely studied up close on Earth, such as fires, floods, storms, and volcanoes. Special instruments on these satellites can study hazards such as hurricanes in ways scientists can never study them on Earth. One satellite, called TRMM (Tropical Rainfall Measuring Mission), can "see" inside a hurricane. TRMM can tell that certain parts of hurricanes normally produce more rain. This information helps meteorologists forecast how much rainfall will affect people on the coast when hurricanes strike. Someday, this research may even help scientists forecast exactly where a hurricane will move onto land. Satellites allow scientists to observe remote parts of Earth that may be impossible to see except from space. Loss of trees in rainforests, the size of mountain glaciers and changes in our ozone layer can be measured best from space. | ||||||||||||||||||||