| NASA | GSFC | JPL | Site Map |
|
||
 |
 |
Education: Student Outcomes |
Filtered by theme: ocean circulation Click here to begin a new search | |||||||||||||||
Grade levels: K-4, 5-8, 9-12 Themes: 21st century technology, ocean circulation, water cycle Flat Tool: http://ourocean.jpl.nasa.gov/AQUARIUS/chp2.jsp GoogleEarth Interface Tool: http://aquarius.jpl.nasa.gov/AQUARIUS_DEV/chp2.jsp Create global maps of mean conditions for any month at designated depths (down to 1500m) using the pull-down menus. Monthly time-series graphs of salinity, temperature, or density can be plotted by selecting up to six locations (by clicking on the map or typing latitude/latitude information into the fields below). These time-series graphs can also represent up to six different depths. Plotted data will also be shown in a table that is easily downloaded (e.g., into Excel). Sources include interpolated atlas data or actual measurements from the database. Focus Questions | Flat Tool Tutorial | |||||||||||||||
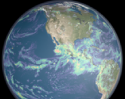
Grade level: 9-12 Theme: ocean circulation Video: elnino-320.flv
These data are from the Goddard Earth Modeling System, a coupled land-ocean-atmosphere model which uses earth and satellite-based observations to simulate the Earth's physical system during events such as El Niño. (source) Compare this video with Components of the Water Cycle: Flow of Atmospheric Water Vapor. | |||||||||||||||
Grade levels: 5-8, 9-12 Themes: climate, ocean circulation Activity: http://www.tos.org/hands-on/teaching_phys_concepts.pdf
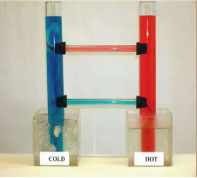
The purpose of this activity is to review basic concepts of thermal physics and highlight applications to ocean processes by focusing on the concept of convection. Convection and advection are the major modes of heat transfer in the ocean and atmosphere. Convection occurs only in fluids and involves vertical motion of fluid, or flow, rather than interactions at the molecular level. It results from differences in densities - hence buoyancy - of fluids. Examples of convective processes include: currents in Earth's mantle, which drive the tectonic system and result from heating and cooling of magma; atmospheric circulation resulting from uneven solar heating (e.g., between the poles and the equator); the global ocean conveyor belt and formation of deep water masses, resulting from cooling of surface water at high latitudes; and vertical mixing in the ocean's upper layer due to variations in heating between day and night. Advection usually refers to horizontal transfer of heat with the flow of water (e.g., the Gulf Stream). Read the following sections of Chapter 4 (Heat and Temperature) in preparation for this activity: • Background (p. 32) • Mechanisms of Heat Transfer (p. 33) Videos
Flash Video | QuickTime Movie
| |||||||||||||||
Grade levels: 5-8, 9-12 Theme: ocean circulation Video: density_effects.flv
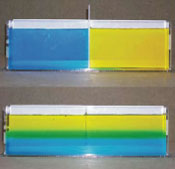
But in the ocean it often happens that the reverse happens: so we might get something that's heavy, heavier (like) more dense waters on top of lighter water. And when that happens, we say that the ocean is unstable and we have "overturning". That means that the waters that are heavy come down to the bottom part of the ocean and those that are light need to go up. And that happens when waters are cooled and it also happens when the upper waters get saltier because of evaporation, etc. So those density differences mean that the ocean is going to circulate: it's going to move. And those density differences can come about because of temperature changes or salinity changes. | |||||||||||||||
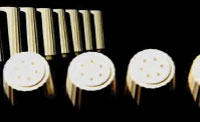
Grade level: 5-8 Theme: ocean circulation Activity: http://aquarius.nasa.gov/seawater_mix_sink.html Big Idea Two of the most important characteristics of ocean water are its temperature and salinity. Together they help govern the density of seawater, which is a major factor controlling the ocean's vertical movements and layered circulation. Key Concepts Sea water has characteristic properties (e.g. density) that are independent of sample size.
There are two main factors that make ocean water more or less dense: temperature and salinity.
Cold, salty water is denser than warm, fresher water and will sink below the less dense layer.
Density is defined as the measure of a material's mass (e.g. grams) divided by its volume (e.g. milliliters).
Mixing of seawater influences the density of seawater thereby affecting ocean circulation. Seawater mixing also has an effect on ocean life.
Background Density is weight divided by volume. The density of fresh water is 1 gram (mass) per cubic centimeter (volume). In other words, if you had a cube with the dimensions: 1cm x 1cm x 1cm; and filled it with pure water, that cube of water would weigh 1 gram. This density is expressed as 1 g/cm3. If you dissolve salt into the water, the salt will increase the fluid's mass, while its volume will remain the same. Thus, the liquid's density will increase. (more) | |||||||||||||||
Grade levels: 5-8, 9-12 Theme: ocean circulation Activity: http://www.tos.org/hands-on/teaching_phys_concepts.pdf
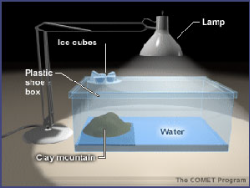
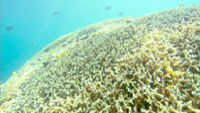
Stratification forms an effective barrier for the exchange of nutrients and dissolved gases between the top, illuminated surface layer where phytoplankton can thrive, and the deep, nutrientrich waters. Stratification therefore has important implications for biological and biogeochemical processes in the ocean. For example, periods of increased ocean stratification have been associated with decreases in surface phytoplankton biomass. In coastal waters, prolonged periods of stratification can lead to hypoxia (low oxygen), causing mortality of fish, crabs, and other marine organisms. This activity compares salt and fresh water, demonstrating that fluids arrange into layers according to their densities. Students in grades 9-12 should read the Background section (p. 4-5) of Chapter 1 (Density) in preparation for this activity. Videos
Flash Video | QuickTime Movie | |||||||||||||||
Grade levels: 5-8, 9-12 Theme: ocean circulation Activity: http://www.tos.org/hands-on/teaching_phys_concepts.pdf
Stratification forms an effective barrier for the exchange of nutrients and dissolved gases between the top, illuminated surface layer where phytoplankton can thrive, and the deep, nutrientrich waters. Stratification therefore has important implications for biological and biogeochemical processes in the ocean. For example, periods of increased ocean stratification have been associated with decreases in surface phytoplankton biomass. In coastal waters, prolonged periods of stratification can lead to hypoxia (low oxygen), causing mortality of fish, crabs, and other marine organisms. This activity compares warm and cold water, demonstrating that fluids arrange into layers according to their densities. Students in grades 9-12 should read the Background section (p. 4-5) of Chapter 1 (Density) in preparation for this activity. Videos
Flash Video | QuickTime Movie | |||||||||||||||
Grade level: 9-12 Theme: ocean circulation Article: documents/21.1_yashayaev.pdf The Labrador Sea is the coldest and freshest basin of the North Atlantic. Winter cooling in this sea produces Labrador Sea Water. This intermediate water plays an important role in the exchange of heat, freshwater, and other substances between the atmosphere and the abyssal ocean, affecting the water masses, circulation, and, ultimately, climate of the subpolar North Atlantic basins. The subpolar gyre of the North Atlantic has exhibited large changes in temperature, salinity, and volume over the past six decades, largely in response to changing winter conditions over the Labrador Sea. The signature of these changes can be seen in the lower limb of the Meridional Overturning Circulation down into the North Atlantic tropics. Read and discuss the Abstract and Introduction (p. 30-32). | |||||||||||||||
Grade level: 5-8 Theme: ocean circulation Video: salinity_importance.flv The salt in the ocean affects its density, just like the temperature affects its density. And the density, meaning the amount of mass per volume, is going to then impact how the ocean circulates, it's going to impact where the water goes as it circulates throughout the globe. | |||||||||||||||
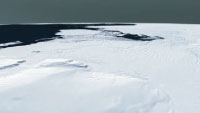
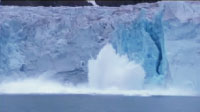
Grade level: 9-12 Themes: climate, ocean circulation, water cycle Video: melting_ice_03.flv
Lora Koenig: "Even though the polar regions seem very far from a lot of people's day to day life, they are very important. Because they are regions that cool our earth. And as they change, they're going to cause larger changes throughout the rest of the globe." (source) | |||||||||||||||
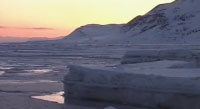
Grade level: 9-12 Themes: climate, ocean circulation, water cycle Video: melting_ice_02.flv
Lora Koenig: "What we're seeing right now on the ice sheets and glaciers is that they are shrinking in size. And as glaciers on land are shrinking overall, that contributes a little bit to sea level rise. And we are worried that as we see warming over the ice sheets, and increased melting over the ice sheets, that they are going to start contributing much more to sea level rise." (source) | |||||||||||||||
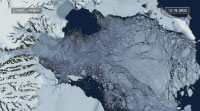
Grade level: 9-12 Themes: climate, ocean circulation, water cycle Video: melting_ice_04.flv
Josh Willis: "As the great ice sheets in Antarctica and Greenland begin to melt and break up due to global warming, we really might experience very rapid sea level rise; three or four times as fast as the rate that we see today. So predicting this rate out into the future is very tricky because we really don't know when the ice sheets might break up and how fast they will when they do. So predicting future sea level rise is one of the great scientific problems of the future." (source) | |||||||||||||||
Grade level: 9-12 Themes: climate, ocean circulation, water cycle Video: melting_ice_01.flv
Josh Willis: "I prefer not to think about climate change and global warming in terms of doom and gloom scenarios, so much as a change in our planet. Our planet's definitely changing, and we're definitely causing it. So we're going to have learn to deal with some of these changes. But in addition, we're going to have to learn how to make a slightly smaller footprint on our planet." Josh Willis: "Sea level is rising effectively because of global warming. As the planet heats up, two things happen to the ocean. One is that the temperature of the water increases. And as that happens, the water actually expands and takes up more room. The other thing that happens is that ice that was on land in the form of glaciers and ice sheets begins to melt and as that runs off into the ocean, it increases the water in the ocean, and it actually raises sea level as well. (source) | |||||||||||||||
Grade level: 9-12 Theme: ocean circulation Tool: http://mynasadata.larc.nasa.gov/preview_lesson.php?&passid=68
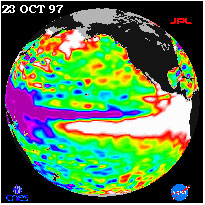
It is believed that El Niños occur every two to eight years, and are sometimes stronger, sometimes weaker. This often happens when the southeast trade winds weaken or even reverse. As a result, large masses of water from the western Pacific Ocean migrate to the east to the coast of South America. This change in ocean circulation not only impacts the weather and climate in South America, but also affects locations all around the globe. These effects can last for about a year, when the opposite conditions occur as the trade winds strengthen again, and the waters off the coast of South America are colder than normal from active upwelling occurring along the coast. This phase of the global circulation disruption is called La Niña. We have been fortunate over the last 30 years to have satellite and buoy data to warn us if the El Niño phase is upon us. By measuring sea surface heights with satellites like TOPEX Poseidon, sea surface temperature with satellites like AVHRR, and wind vectors from buoys and satellites, we can monitor the Pacific Ocean for changes that may signal the onset of El Niño or La Niña. The sensitive altimeter on the TOPEX Poseidon satellite can measure small changes that create hills and valleys on the sea surface which is mostly caused by thermal expansion (steric effect), and the warming of the ocean during an El Niño event can be sensed by the altimeter. This lesson explores El Niño by looking at sea surface temperature, sea surface height, and wind vectors in order to seek out any correlations there may be among these three variables. It employs group work where different teams work together to analyze a single variable, and then get together in different groups to compare all three variables. The lesson will guide students through data representing the strong El Niño from 1997 to 1998. By doing this, students will model the methods of researchers who bring their expertise to study integrated science questions. Depending on the classroom dynamics, available technology, and available time, this lesson may be modified. | |||||||||||||||
Grade levels: 5-8, 9-12 Themes: climate, ocean circulation Tool: http://oceanmotion.org/html/resources/oscar.htm This data visualizer gives access to the following global ocean surface current behaviors between 1992 and 2008: current speed, current direction, current convergence, and current vorticity as well as the anomaly values for each. | |||||||||||||||
Grade level: 9-12 Theme: ocean circulation Article: http://www.nasa.gov/centers/goddard/news/topstory/2003/0114salt.html
This study, conducted for NASA by University of Maryland researchers Joaquim Ballabrera, Tony Busalacchi, and Ragu Murtugudde, is one of the first to look at ocean salinity in El Niño, Southern Oscillation (ENSO) predictions and their relationship to tropical sea surface temperatures, sea level, winds, and fresh water from rain. | |||||||||||||||
Grade levels: 5-8, 9-12 Themes: climate, ocean circulation, water cycle Video: salt_of_earth_03.flv
Jeff Halverson: "Climate change on earth is complicated by the fact that the ocean moves much more slowly than the atmosphere. So you have warming in the atmosphere, warming in the ocean, but they're occurring at different speeds. So they're out of sync, and that makes predicting what's going to happen in the next hundred or two years very, very difficult." Susan Lozier: "Now what we might expect happens, in a very simplistic sense, is that as the ocean warms, there's going to be more evaporation. And that more evaporation would would mean that oceans become saltier. But really it's not just that simple because there's also evaporation, precipitation, and the ice as well, and that's all wrapped up in the study of the hydrologic cycle." (source) | |||||||||||||||
Grade levels: 5-8, 9-12 Themes: climate, ocean circulation, water cycle Video: salt_of_earth_02.flv
Jeff Halverson: "It takes perhaps a thousand years for the water to cycle through the deep ocean. So we say the oceans have a memory. They're like a tape recorder. Things that happen now will still be manifest hundreds of years in the future as that cold water moves through this giant circulation." Susan Lozier: "So if there's any change to that overturning circulation, that means that Northern Europe and the British Isles would be robbed of that heat due to those waters that are returning to the high latitudes." (source) | |||||||||||||||
Grade levels: 5-8, 9-12 Themes: ocean circulation, water cycle Video: salt_of_earth_01.flv
It's these differences in salinity that play a role in the processes that affect weather, climate, sea life, and the whole ocean system itself. And not all oceans have the same salinity. In fact, the North Atlantic Ocean tends to be the saltiest, much more than the Pacific. Susan Lozier: "The salt in the ocean affects its density, just like the temperature affects its density, and the density, meaning the amount mass per volume, is going to then impact where the water goes as it circulates throughout the globe." Jeff Halverson: "Differences in temperature and salt content of the water cause some areas of water to sink and some areas of water to rise. And so we tend to see the sinking water at the poles, the water rising back up at the equator, and if you connect the two together, what you have is an overturning that is deep in the ocean. It's like a big conveyor belt that operates in the ocean." This overturning moves warm water from the tropics toward the poles, and cold water from the poles toward the tropics. In this way the overturning regulates earth's climate. (source) | |||||||||||||||
Grade levels: 5-8, 9-12 Themes: ocean circulation, water cycle Video: density_reverse_direction.flv
| |||||||||||||||
Grade level: 9-12 Theme: ocean circulation Video: sss_reverse_direction.flv
| |||||||||||||||
Grade level: 5-8 Theme: ocean circulation Video: sst_reverse_direction.flv
| |||||||||||||||
Grade levels: 5-8, 9-12 Themes: 21st century technology, climate, ocean circulation, water cycle Flat Tool: http://ourocean.jpl.nasa.gov/AQUARIUS/chp1.jsp GoogleEarth Interface Tool: http://aquarius.jpl.nasa.gov/AQUARIUS_DEV/chp1.jsp Interactive maps of surface conditions can be clicked to create in-water profiles of salinity, temperature, or density. Sources include interpolated atlas data or actual measurements from the database. Focus Questions | Flat Tool Tutorial | |||||||||||||||
Grade levels: K-4, 5-8, 9-12 Themes: ocean circulation, water cycle Video: water_cycle_ipod_640x480.m4v.flv
Clouds can move great distances and eventually the water molecule will fall as rain or snow. Ultimately, the water molecule arrives back where it started...at the ocean. (source) | |||||||||||||||
Grade level: K-4 Theme: ocean circulation Activity: http://aquarius.nasa.gov/water_cycle.html
Water can change states among liquid, vapor (gas), and ice (solid) at various stages of the water cycle. Temperature affects the change of water from one state to another. When water vapor gets cold it changes to a liquid. This is called condensation. When heat is applied to water, it changes from a liquid to a gas. This is called evaporation. This activity will focus specifically on two aspects of the water cycle: evaporation and condensation. Key Concepts Evaporation occurs when a liquid is changed into a gas.
Evaporation occurs when the temperature of a liquid is increased.
Condensation occurs when a gas is changed into a liquid.
Condensation occurs when the temperature of the vapor decreases.
When the sun heats up water in rivers, lakes or the ocean, it turns into vapor or steam. The water vapor or steam leaves the body of water and goes into the air. Background The water cycle has no starting point. But we'll begin in the oceans, since that is where most of the Earth's water exists. The sun, which drives the water cycle, heats water in the oceans. Some of it evaporates as vapor into the air. Ice and snow can sublimate directly into water vapor. Rising air currents take the vapor up into the atmosphere, along with water from evapotranspiration, which is water transpired from plants and evaporated from the soil. The vapor rises into the air where cooler temperatures causes it to condese into clouds. | |||||||||||||||
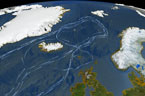
Grade levels: 5-8, 9-12 Theme: ocean circulation Video: thermohaline_conveyor_iPod.m4v.flv
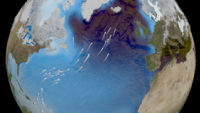
This animation shows one of the major regions where this pumping occurs: the North Atlantic Ocean around Greenland, Iceland, and the North Sea. The surface ocean current brings new water to this region from the South Atlantic via the Gulf Stream and the water returns to the South Atlantic via the North Atlantic Deep Water current. The continual influx of warm water into the North Atlantic polar ocean keeps the regions around Iceland and southern Greenland mostly free of sea ice year round. The animation also shows another feature of the global ocean circulation: the Antarctic Circumpolar Current. The region around latitude 60 degrees south is the the only part of the Earth where the ocean can flow all the way around the world with no land in the way. As a result, both the surface and deep waters flow from west to east around Antarctica. This circumpolar motion links the world's oceans and allows the deep water circulation from the Atlantic to rise in the Indian and Pacific Oceans and the surface circulation to close with the northward flow in the Atlantic. (source) | |||||||||||||||
Grade levels: 5-8, 9-12 Theme: ocean circulation Video: thermohaline_rev.flv
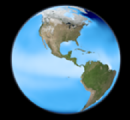
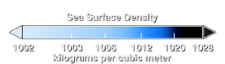
The animation also shows another feature of the global ocean circulation: the Antarctic Circumpolar Current. The region around latitude 60 south is the only part of the Earth where the ocean can flow all the way around the world with no obstruction by land. As a result, both the surface and deep waters flow from west to east around Antarctica. This circumpolar motion links the world's oceans and allows the deep water circulation from the Atlantic to rise in the Indian and Pacific Oceans, thereby closing the surface circulation with the northward flow in the Atlantic. The color on the world's ocean's at the beginning of this animation represents surface water density, with dark regions being most dense and light regions being least dense (see the animation Sea Surface Temperature, Salinity and Density). The depths of the oceans are highly exaggerated (100x in oceans, 20x on land) to better illustrate the differences between the surface flows and deep water flows. The actual flows in this model are based on current theories of the thermohaline circulation rather than actual data. The thermohaline circulation is a very slow moving current that can be difficult to distinguish from general ocean circulation. Therefore, it is difficult to measure or simulate. This version of the visualization combines the Earth look of the original thermohaline visualization with the new thermohaline flow field generated for the Science on a Sphere production, "Loop". (source) | |||||||||||||||
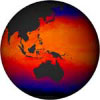
Grade level: 9-12 Theme: ocean circulation Activity: documents/vtop_oc_variations_el_nino.pdf An El Niño is thought to be triggered when steady westward blowing trade winds weaken and even reverse direction in the western Pacific Ocean, near New Guinea and Australia. This change in the winds allows the large mass of warm water that is normally located in the western Pacific to move eastward along the equator until it reaches the coast of South America. This displaced pool of unusually warm water affects evaporation and where rain clouds form, altering the typical atmospheric jet stream patterns around the world. Scientists are studying information from satellites and in-water buoys to better understand the causes and effects of an El Niño. In this activity, students will analyze satellite images of sea surface temperature, sea surface topography, and wind data from an El Niño period and compare and contrast these data with non-El Niño conditions. | |||||||||||||||
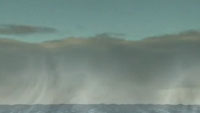
Grade levels: K-4, 9-12 Themes: ocean circulation, water cycle Video: water_everywhere_02.flv
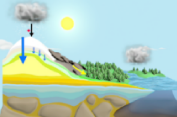
Condensation is the process by which water vapor molecules cool, stick together, and become liquid again in cloud formation. This often happens high in the atmosphere where the temperature is much lower than it is near the surface. Paula Bontempi: "What happens in the atmosphere is, just like we have currents in the ocean, we have winds in the atmosphere that actually, to some extent, drive what goes on in the ocean currents. Materials in the atmosphere can travel a great distance, sometimes a quarter of a way around the world, just until they get to the point where they actually turn into rain or snow and thereby fall back to the ocean or fall back to the land. This is called precipitation. If the water molecule falls on the land as snow, it may be stored for a very long period of time in a polar ice sheet or mountain glacier, depending on climate conditions." Matt Rodell: "When rain falls or the snow melts, typically the next place it goes, it infiltrates the soil. So soil is not solid. It's not like a rock, there are pore spaces that can be filled with water and typically there is a certain amount of water in the soil at all times. If soil was completely dry, plants wouldn't be able to grow." (source) | |||||||||||||||
Grade levels: K-4, 9-12 Themes: ocean circulation, water cycle Video: WC_precipitation_IPOD.m4v.flv
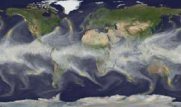
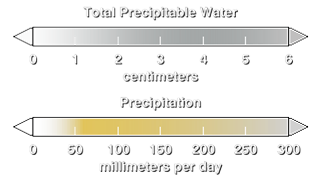
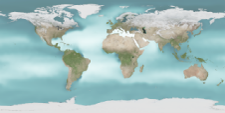
Water regulates climate, storing heat during the day and releasing it at night. Water in the ocean and atmosphere carry heat from the tropics to the poles. The process by which water moves around the earth, from the ocean, to the atmosphere, to the land and back to the ocean is called the water cycle. This animation was created using data from the GEOS-5 atmospheric model on the cubed-sphere, run at 14-km global resolution for 30-days. Variables animated here include evaporation, water vapor and precipitation. This animation is time synchronous throughout the animation to allow cross fades during compositing. (source) | |||||||||||||||
Grade levels: K-4, 5-8, 9-12 Themes: ocean circulation, water cycle Video: water_everywhere_01.flv
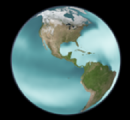
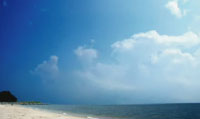
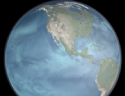
Let's follow a single molecule of water, beginning in the ocean, through the paths it might take before eventually winding up right where it started - back in the big blue sea. The fuel for this journey will be provided by our planet's prime energy source: the sun. During the day, the sun heats up the air and ocean surface, causing water molecules to evaporate. Evaporation occurs when a liquid molecule of water escapes into the air as a gas. This scientific visualization shows how water evaporation, indicated in turquoise, is driven by the energy of the sun. Notice how the rate of evaporation pulses over land: it speeds up during the day and almost disappears at night. Over the ocean, evaporation appears to remain constant, both day and night. Water in the air in gas form is known as water vapor. The molecule is now fresh water, having left the ocean salt and other particles behind. (source) | |||||||||||||||
Grade levels: K-4, 5-8, 9-12 Themes: ocean circulation, water cycle Video: Evap_and_clock_IPOD.m4v.flv
Water regulates climate, storing heat during the day and releasing it at night. Water in the ocean and atmosphere carry heat from the tropics to the poles. The process by which water moves around the earth, from the ocean, to the atmosphere, to the land and back to the ocean is called the water cycle. This animation was created using data from the GEOS-5 atmospheric model on the cubed-sphere, run at 14-km global resolution for 30-days. Variables animated here include evaporation, water vapor and precipitation. This animation is time synchronous throughout the animation to allow cross fades during compositing. (source) | |||||||||||||||
Grade levels: K-4, 5-8, 9-12 Themes: ocean circulation, water cycle Video: WC_evaporation_IPOD.m4v.flv
Water regulates climate, storing heat during the day and releasing it at night. Water in the ocean and atmosphere carry heat from the tropics to the poles. The process by which water moves around the earth, from the ocean, to the atmosphere, to the land and back to the ocean is called the water cycle. This animation was created using data from the GEOS-5 atmospheric model on the cubed-sphere, run at 14-km global resolution for 30-days. Variables animated here include evaporation, water vapor and precipitation. This animation is time synchronous throughout the animation to allow cross fades during compositing. (source) | |||||||||||||||
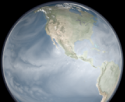
Grade levels: K-4, 5-8, 9-12 Themes: ocean circulation, water cycle Video: WC_vapor_IPOD.m4v.flv
Water regulates climate, storing heat during the day and releasing it at night. Water in the ocean and atmosphere carry heat from the tropics to the poles. The process by which water moves around the earth, from the ocean, to the atmosphere, to the land and back to the ocean is called the water cycle. This animation was created using data from the GEOS-5 atmospheric model on the cubed-sphere, run at 14-km global resolution for 30-days. Variables animated here include evaporation, water vapor and precipitation. This animation is time synchronous throughout the animation to allow cross fades during compositing. (source) | |||||||||||||||
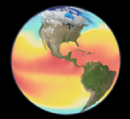
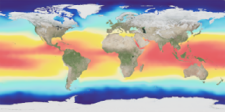
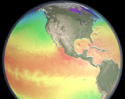
Grade levels: K-4, 5-8, 9-12 Themes: ocean circulation, water cycle Video: WC_SST_IPOD.m4v.flv
Water regulates climate, storing heat during the day and releasing it at night. Water in the ocean and atmosphere carry heat from the tropics to the poles. The process by which water moves around the earth, from the ocean, to the atmosphere, to the land and back to the ocean is called the water cycle. Data for this animation was derived from a model run of ECCO's Ocean General Circulation Model of heat along the ocean's surface. (source) | |||||||||||||||
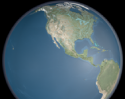
Grade levels: K-4, 5-8, 9-12 Themes: ocean circulation, water cycle Video: WC_rivers_IPOD.m4v.flv
Water regulates climate, storing heat during the day and releasing it at night. Water in the ocean and atmosphere carry heat from the tropics to the poles. The process by which water moves around the earth, from the ocean, to the atmosphere, to the land and back to the ocean is called the water cycle. (source) | |||||||||||||||