| NASA | GSFC | JPL | Site Map |
|
||
 |
 |
Education: Student Outcomes |
Filtered by outcome: 9-12q4 Click here to begin a new search | ||||||||||||||||||||||||||||||||||||||||||||||||||||||||||||||||||||||||||||||||||||||||||||||||||||||||||||||||||||||||||||
Outcome: Explain the influence of ocean salinity on the thermohaline circulation (e.g., "global conveyor belt"). | ||||||||||||||||||||||||||||||||||||||||||||||||||||||||||||||||||||||||||||||||||||||||||||||||||||||||||||||||||||||||||||
Grade level: 9-12 Theme: ocean circulation Flat Tool: http://ourocean.jpl.nasa.gov/AQUARIUS/chp2.jsp GoogleEarth Interface Tool: http://aquarius.jpl.nasa.gov/AQUARIUS_DEV/chp2.jsp Create global maps of mean conditions for any month at designated depths (down to 1500m) using the pull-down menus. Monthly time-series graphs of salinity, temperature, or density can be plotted by selecting up to six locations (by clicking on the map or typing latitude/latitude information into the fields below). These time-series graphs can also represent up to six different depths. Plotted data will also be shown in a table that is easily downloaded (e.g., into Excel). Sources include interpolated atlas data or actual measurements from the database. Focus Questions | Flat Tool Tutorial Grade level: 9-12 Theme: ocean circulation Activity: http://www.tos.org/hands-on/teaching_phys_concepts.pdf
The purpose of this activity is to review basic concepts of thermal physics and highlight applications to ocean processes by focusing on the concept of convection. Convection and advection are the major modes of heat transfer in the ocean and atmosphere. Convection occurs only in fluids and involves vertical motion of fluid, or flow, rather than interactions at the molecular level. It results from differences in densities - hence buoyancy - of fluids. Examples of convective processes include: currents in Earth's mantle, which drive the tectonic system and result from heating and cooling of magma; atmospheric circulation resulting from uneven solar heating (e.g., between the poles and the equator); the global ocean conveyor belt and formation of deep water masses, resulting from cooling of surface water at high latitudes; and vertical mixing in the ocean's upper layer due to variations in heating between day and night. Advection usually refers to horizontal transfer of heat with the flow of water (e.g., the Gulf Stream). Read the following sections of Chapter 4 (Heat and Temperature) in preparation for this activity: • Background (p. 32) • Mechanisms of Heat Transfer (p. 33) Videos
Flash Video | QuickTime Movie
Grade level: 9-12 Theme: ocean circulation Video: density_effects.flv
But in the ocean it often happens that the reverse happens: so we might get something that's heavy, heavier (like) more dense waters on top of lighter water. And when that happens, we say that the ocean is unstable and we have "overturning". That means that the waters that are heavy come down to the bottom part of the ocean and those that are light need to go up. And that happens when waters are cooled and it also happens when the upper waters get saltier because of evaporation, etc. So those density differences mean that the ocean is going to circulate: it's going to move. And those density differences can come about because of temperature changes or salinity changes. Grade level: 9-12 Theme: ocean circulation Activity: http://www.tos.org/hands-on/teaching_phys_concepts.pdf
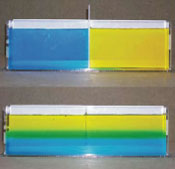
Stratification forms an effective barrier for the exchange of nutrients and dissolved gases between the top, illuminated surface layer where phytoplankton can thrive, and the deep, nutrientrich waters. Stratification therefore has important implications for biological and biogeochemical processes in the ocean. For example, periods of increased ocean stratification have been associated with decreases in surface phytoplankton biomass. In coastal waters, prolonged periods of stratification can lead to hypoxia (low oxygen), causing mortality of fish, crabs, and other marine organisms. This activity compares salt and fresh water, demonstrating that fluids arrange into layers according to their densities. Students in grades 9-12 should read the Background section (p. 4-5) of Chapter 1 (Density) in preparation for this activity. Videos
Flash Video | QuickTime MovieGrade level: 9-12 Theme: ocean circulation Activity: http://www.tos.org/hands-on/teaching_phys_concepts.pdf
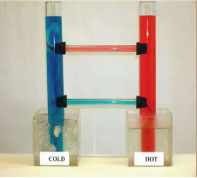
Stratification forms an effective barrier for the exchange of nutrients and dissolved gases between the top, illuminated surface layer where phytoplankton can thrive, and the deep, nutrientrich waters. Stratification therefore has important implications for biological and biogeochemical processes in the ocean. For example, periods of increased ocean stratification have been associated with decreases in surface phytoplankton biomass. In coastal waters, prolonged periods of stratification can lead to hypoxia (low oxygen), causing mortality of fish, crabs, and other marine organisms. This activity compares warm and cold water, demonstrating that fluids arrange into layers according to their densities. Students in grades 9-12 should read the Background section (p. 4-5) of Chapter 1 (Density) in preparation for this activity. Videos
Flash Video | QuickTime MovieGrade level: 9-12 Theme: ocean circulation Article: documents/21.1_yashayaev.pdf The Labrador Sea is the coldest and freshest basin of the North Atlantic. Winter cooling in this sea produces Labrador Sea Water. This intermediate water plays an important role in the exchange of heat, freshwater, and other substances between the atmosphere and the abyssal ocean, affecting the water masses, circulation, and, ultimately, climate of the subpolar North Atlantic basins. The subpolar gyre of the North Atlantic has exhibited large changes in temperature, salinity, and volume over the past six decades, largely in response to changing winter conditions over the Labrador Sea. The signature of these changes can be seen in the lower limb of the Meridional Overturning Circulation down into the North Atlantic tropics. Read and discuss the Abstract and Introduction (p. 30-32). Grade level: 9-12 Theme: ocean circulation Video: density_reverse_direction.flv
Grade level: 9-12 Theme: ocean circulation Video: sss_reverse_direction.flv
Grade level: 9-12 Theme: ocean circulation Flat Tool: http://ourocean.jpl.nasa.gov/AQUARIUS/chp1.jsp GoogleEarth Interface Tool: http://aquarius.jpl.nasa.gov/AQUARIUS_DEV/chp1.jsp Interactive maps of surface conditions can be clicked to create in-water profiles of salinity, temperature, or density. Sources include interpolated atlas data or actual measurements from the database. Focus Questions | Flat Tool Tutorial Grade level: 9-12 Theme: ocean circulation Video: thermohaline_conveyor_iPod.m4v.flv
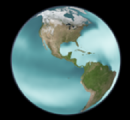
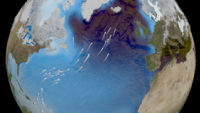
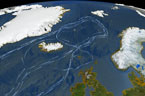
This animation shows one of the major regions where this pumping occurs: the North Atlantic Ocean around Greenland, Iceland, and the North Sea. The surface ocean current brings new water to this region from the South Atlantic via the Gulf Stream and the water returns to the South Atlantic via the North Atlantic Deep Water current. The continual influx of warm water into the North Atlantic polar ocean keeps the regions around Iceland and southern Greenland mostly free of sea ice year round. The animation also shows another feature of the global ocean circulation: the Antarctic Circumpolar Current. The region around latitude 60 degrees south is the the only part of the Earth where the ocean can flow all the way around the world with no land in the way. As a result, both the surface and deep waters flow from west to east around Antarctica. This circumpolar motion links the world's oceans and allows the deep water circulation from the Atlantic to rise in the Indian and Pacific Oceans and the surface circulation to close with the northward flow in the Atlantic. (source) Grade level: 9-12 Theme: ocean circulation Video: thermohaline_rev.flv
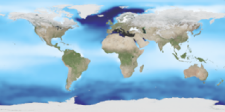
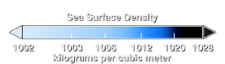
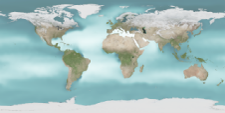
The animation also shows another feature of the global ocean circulation: the Antarctic Circumpolar Current. The region around latitude 60 south is the only part of the Earth where the ocean can flow all the way around the world with no obstruction by land. As a result, both the surface and deep waters flow from west to east around Antarctica. This circumpolar motion links the world's oceans and allows the deep water circulation from the Atlantic to rise in the Indian and Pacific Oceans, thereby closing the surface circulation with the northward flow in the Atlantic. The color on the world's ocean's at the beginning of this animation represents surface water density, with dark regions being most dense and light regions being least dense (see the animation Sea Surface Temperature, Salinity and Density). The depths of the oceans are highly exaggerated (100x in oceans, 20x on land) to better illustrate the differences between the surface flows and deep water flows. The actual flows in this model are based on current theories of the thermohaline circulation rather than actual data. The thermohaline circulation is a very slow moving current that can be difficult to distinguish from general ocean circulation. Therefore, it is difficult to measure or simulate. This version of the visualization combines the Earth look of the original thermohaline visualization with the new thermohaline flow field generated for the Science on a Sphere production, "Loop". (source) | ||||||||||||||||||||||||||||||||||||||||||||||||||||||||||||||||||||||||||||||||||||||||||||||||||||||||||||||||||||||||||||