| NASA | GSFC | JPL | Site Map |
|
||
 |
 |
Education: Student Outcomes |
Filtered by theme: water cycle Click here to begin a new search | |||||||||||||||
Grade levels: 5-8, 9-12 Theme: water cycle Tool: http://aquarius.nasa.gov/education-datatools.html
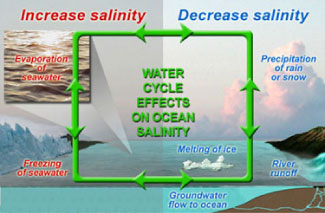
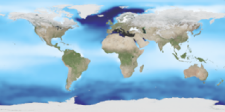
Salinity patterns are governed by geographic differences in the "water budget." For example, like on continents, some areas of the ocean are rainy whereas others are arid and "desert-like." To learn more about the factors that influence salinity patterns, we invite you investigate five pairs of data maps centered over the North Atlantic Ocean (listed below). Each map shows monthly conditions based on long-term averages. The challenge is to find the data set that most closely corresponds to sea surface salinity patterns. Grade level 5-8: Look at monthly maps of: air temperature vs. sea surface salinity and precipitation vs. sea surface salinity. Are any of these data sets closely correlated with solar energy input (e.g., seasonal change)? Grade level 9-12: For the North Atlantic Ocean, look at monthly maps of air temperature vs. sea surface salinity and precipitation vs. sea surface salinity and evaporation vs. sea surface salinity. Are changes in these data sets closely correlated with solar energy input (e.g., seasonal change) in the North Atlantic ocean? Look at these videos -- Sea Surface Salinity and Components of the Water Cycle for global data sets of sea surface temperature, precipitation, and evaporation. | |||||||||||||||
Grade levels: K-4, 5-8, 9-12 Themes: 21st century technology, ocean circulation, water cycle Flat Tool: http://ourocean.jpl.nasa.gov/AQUARIUS/chp2.jsp GoogleEarth Interface Tool: http://aquarius.jpl.nasa.gov/AQUARIUS_DEV/chp2.jsp Create global maps of mean conditions for any month at designated depths (down to 1500m) using the pull-down menus. Monthly time-series graphs of salinity, temperature, or density can be plotted by selecting up to six locations (by clicking on the map or typing latitude/latitude information into the fields below). These time-series graphs can also represent up to six different depths. Plotted data will also be shown in a table that is easily downloaded (e.g., into Excel). Sources include interpolated atlas data or actual measurements from the database. Focus Questions | Flat Tool Tutorial | |||||||||||||||
Grade level: K-4 Theme: water cycle Activity: http://aquarius.nasa.gov/sea_water_freeze.html Big Idea Salt causes water to freeze at a lower temperature. The oceans do not freeze (except in extreme polar areas) because of the salinity (i.e., concentration of salts).
Key Concepts Dissolving any substance in pure water raises or lowers the freezing and boiling point.
When water freezes - goes from the liquid state to the solid state - its molecules go from a disorganized state to an organized state.
When water freezes to a solid, molecular motion slows down enough that the molecules become permanently fixed in an orderly arrangement called a crystal.
The individual particles that make up salt (known as ions) arrange themselves around the water molecules. In doing so, they shield the water molecules from interactions among themselves, making it less likely that they will find each other and form ice.
The water molecules have to be slowed down even more in the presence of salt in order to form a solid. So you have to go to a lower temperature in order to freeze water that contains salt.Salt is excluded in the formation of ice; therefore ice made from salt water is essentially salt-free.
Salt water is denser than freshwater because of its salt content, and, as a result, an object is more buoyant in the ocean than in a freshwater lake. The density of salt water depends on its salinity and varies around the world. Background Under normal conditions, ordinary fresh water freezes and melts at 0°C, or 32°F. If water and ice are at 0°C, which is the melting point of ice and the freezing point of water then molecules of ice are escaping into the water (melting), and molecules of water are being captured on the surface of the ice (freezing). (more) | |||||||||||||||
Grade levels: 5-8, 9-12 Themes: 21st century technology, climate, water cycle Flat Tool: http://ourocean.jpl.nasa.gov/AQUARIUS/chp3.jsp GoogleEarth Interface Tool: http://aquarius.jpl.nasa.gov/AQUARIUS_DEV/chp3.jsp Create global maps of mean conditions for any year(s) from 1800 to 2005 at designated depths (down to 1500m) using the pull-down menus. Annual time-series graphs of salinity, temperature, or density can be plotted by selecting up to six locations (by clicking on the map or typing latitude/latitude information into the fields below). These time-series graphs can also represent up to six different depths. Plotted data will also be shown in a table that is easily downloaded (e.g., into Excel). Source is actual, non-interpolated database measurements. Focus Questions | Flat Tool Tutorial | |||||||||||||||
Grade level: 9-12 Theme: water cycle Video: global_ocean_04.flv
Paula Bontempi: "If the climate actually changes, and the oceans change or respond to that change, it most definitely will impact life as we know it, and especially humans." David Adamec: "To understand exactly how we stay here and how we're going to survive both within the climate, and even our life cycle, it requires understanding what the water is doing." Our climate is changing... in some places, faster than predicted. By using science to understand those changes, we can find ways of protecting our oceans - and ourselves - that make a world of difference. | |||||||||||||||
Grade level: 9-12 Theme: water cycle Video: global_ocean_03.flv
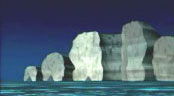
Other satellites show us peaks and valleys, not just on land - but, believe it or not - on the surface of the ocean. And as ice on land melts, there are increasingly more highs than lows. Sea level is rising. | |||||||||||||||
Grade level: 9-12 Theme: water cycle Activity: http://www.tos.org/hands-on/teaching_phys_concepts.pdf
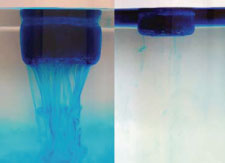
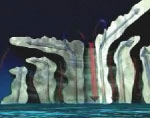
In the left panel in the photo at right, an ice block floats in tap water because the density of ice is lower than that of freshwater. As the ice melts, however, cold, colored meltwater sinks to the bottom because it is denser than the tap water. Warmer water from the bottom is then displaced and upwells, resulting in a convective flow visible in the dye patterns. Ice melting in the center of the tank is analogous to a convection "chimney" formed in the open ocean, while ice melting at the tank's edge is analogous to a chimney on a continental shelf (near a land mass). Such chimneys in the ocean, created and sustained by convective processes, appear as "columns" of mixed water that flow downwards. For a given set of oceanic and meteorological conditions, open-water convection tends to entrain (mix with) more of the surrounding waters than does convection near a land mass. The open-ocean case therefore results in downwelled water that is less dense. In the right panel, the ice block floats in dense, salty water. As the ice melts, only a small amount of dye sinks because the density of the saltwater is greater than the density of the newly melted, fresh, ice-cold water. Most of the meltwater accumulates in a surface layer on top of the denser salt layer. Read the Background section (p. 4-5) of Chapter 1 (Density) in preparation for this activity. Note: Even though this experiment focuses on temperature only, it can be used to discuss how salinity, like temperature, affects the density of ocean water. | |||||||||||||||
Grade level: 9-12 Theme: water cycle Activity: http://www.tos.org/hands-on/teaching_phys_concepts.pdf
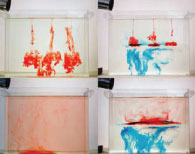
Mixing of stratified layers requires work. Without energetic mixing (e.g., due to wind or breaking waves), the exchanges of gases and nutrients between surface and deep layers will occur by molecular diffusion and local stirring by organisms, which are slow, ineffective modes of transfer. The energy needed for mixing is, at a minimum, the difference in potential energy between the mixed and stratified fluids. Therefore, the more stratified the water column, the higher the energy needed for vertical mixing. Density is fundamentally important to large-scale ocean circulation. An increase in the density of surface water, through a decrease in temperature (cooling) or an increase in salinity (ice formation and evaporation), results in gravitational instability (i.e., dense water overlying less-dense water) and sinking of surface waters to depth. Once a sinking water mass reaches a depth at which its density matches the ambient density, the mass flows horizontally, along "surfaces" of equal density. This process of dense-water formation and subsequent sinking is the driver of thermohaline circulation in the ocean. It is observed in low latitudes (e.g., the Gulf of Aqaba in the Red Sea, the Gulf of Lions in the Mediterranean Sea) as well as in high latitudes (e.g., deep water formation in the North Atlantic). This experiment looks at the energy required to mix two layers. Students should read the Background section (p. 4-5) of Chapter 1 (Density) in preparation for this activity. Videos
Flash Video | QuickTime Movie | |||||||||||||||
Grade level: K-4 Theme: water cycle Activity: http://aquarius.nasa.gov/evap_invest.html Big Idea Water can "disappear" or evaporate into the air.
Key Concepts Evaporation occurs when a liquid is changed into a gas.
Rate of evaporation increases when the temperature of a liquid is increased.
Water moves around our planet in the water cycle.
Background Evaporation is the process by which water changes from a liquid to a gas or vapor. Evaporation is the primary pathway that water moves from the liquid state back into the water cycle as atmospheric water vapor. Studies have shown that the oceans, seas, lakes, and rivers provide nearly 90 percent of the moisture in the atmosphere via evaporation, with the remaining 10 percent being contributed by plant transpiration. | |||||||||||||||
Grade level: K-4 Theme: water cycle Video: salty_regions.flv
And also in the middle of our subtropical gyres. A gyre is a current system that moves around in a circle. The "subtropics" means that it is located in an area around 30 degrees (north) latitude all around the globe. That area is where we have very strong evaporation. That evaporation means that we lose fresh water from the surface. And we lose more fresh water from the surface than we actually gain through precipitation. That area is what we call "the ocean deserts". Now on the fresh side, we have very fresh water near the coastlines and that's because we have the river waters flowing in. And we also have fresh water near the high latitudes where we have ice. | |||||||||||||||
Grade level: 5-8 Theme: water cycle Activity: http://www.tos.org/hands-on/teaching_phys_concepts.pdf
When an object gains heat, two things can happen: the temperature of the object can rise, or the object can change its state without a measurable change in temperature (e.g., ice melting into water). Most materials have two state transitions: from solid to liquid and from liquid to gas. The heat needed to change the state of a material is called latent heat of fusion (for changing from solid to liquid) and latent heat of vaporization (for changing from liquid to gas). Latent heats of fusion and vaporization for water are high and have many important consequences for Earth's climate. Videos
Flash Video | QuickTime Movie | |||||||||||||||
Grade level: 5-8 Theme: water cycle Video: hurricane_cloud_growth.flv
NASA's Tropical Rainfall Measuring Mission (TRMM) provides a closer look at hurricanes using a unique combination of passive and active microwave instruments designed to peer inside cloud systems and measure rainfall. TRMM allows scientists to study the combustion process in the hurricane engine and relate this process to intensification or weakening. (source) | |||||||||||||||
Grade level: 5-8 Theme: water cycle Video: hurricane_latent_heat.flv
NASA's Tropical Rainfall Measuring Mission (TRMM) provides a closer look at hurricanes using a unique combination of passive and active microwave instruments designed to peer inside cloud systems and measure rainfall. TRMM allows scientists to study the combustion process in the hurricane engine and relate this process to intensification or weakening. (source) | |||||||||||||||
Grade level: 5-8 Theme: water cycle Video: hurricane_heat_engine.flv
The release of latent heat warms the surrounding air, making it lighter, which promotes updrafts (shown as blue arrows) and vigorous cloud development. Red arrows show areas of low atmospheric pressure. It is suspected that rapid bursts of cloud growth, particularly in the eyewall region of hurricanes, may relate to the intensification phase of a storm. (source) Read Prerequisite Knowledge (p. 2-4). | |||||||||||||||
Grade level: 5-8 Theme: water cycle Activity: http://www.nasa.gov/pdf/62319main_ICS_Energy.pdf
Read the section on Prerequisite Knowledge (p. 2-4). | |||||||||||||||
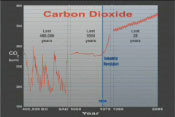
Grade level: 9-12 Themes: climate, water cycle Video: keeping_up_carbon_03.flv
Researchers are learning that future climate change will depend on carbon levels in the land, in the atmosphere, and in the sea, and how these levels respond to human disturbance. About one-third of all human-generated carbon emissions has dissolved into the ocean. More than 80% of Earth's added heat is now stored in the ocean. Scott Doney: "In the future, as the planet gets warmer, the water's going to warm up, and warm water can hold less carbon than cold water - the other thing is, on a warmer planet, some of the currents are going to slow down, so we might not be forming as much of this cold deep water. So we won't be able to transport carbon into the deep sea. So on the whole, the ocean's going to become less effective at removing carbon from the atmosphere." (source) | |||||||||||||||
Grade level: 9-12 Themes: climate, water cycle Video: keeping_up_carbon_04.flv
Stacey Boland: "As the ocean absorbs more carbon dioxide, it becomes more acidic, and this can be a threat to some of the organisms that live inside the ocean." As Earth's climate continues to change, how will researchers monitor something as big as the ocean, and something as complex as the carbon cycle? NASA Earth observing satellites give scientists the "big picture" view of our home planet. Varied satellites help researchers detect changes in ocean climate and ecology over time, providing vital insight into the health of our home planet. (source) | |||||||||||||||
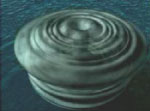
Grade level: K-4 Theme: water cycle Activity: http://aquarius.nasa.gov/liquid_rainbow.html Big Idea When solutions of two different densities meet, the lower density (less dense) solution will move on top of the higher density (more dense) solution, resulting in a layering or stratification of the solutions. Density is an important feature of seawater since many physical and biological processes are affected by it, such as moving heat around the globe influencing climate and feeding and reproduction by marine organisms. Key Concepts Different densities of water, or solutions, will stratify to form layers.
Density of ocean water is influenced by temperature and salinity.
Cold water with dissolved salts (higher salinity) is denser than warm water without dissolved salts (low or no salinity).
In the oceans, the deep, bottom layer is colder and saltier than the surface layer.
Background Density is a property of matter that can be introduced at the elementary level by thinking of it in terms of the relationship between weight and volume. How can two objects that are the same size have different weights? The answer has to do with their density. An object's density is determined by comparing its mass to its volume. If you compare a rock and a cork that are the same size (they have equal volume), which is heavier? The rock is, because it has more mass. Thus the rock is denser than the cork because it has more mass in the same volume. | |||||||||||||||
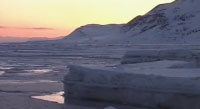
Grade level: 9-12 Themes: climate, ocean circulation, water cycle Video: melting_ice_03.flv
Lora Koenig: "Even though the polar regions seem very far from a lot of people's day to day life, they are very important. Because they are regions that cool our earth. And as they change, they're going to cause larger changes throughout the rest of the globe." (source) | |||||||||||||||
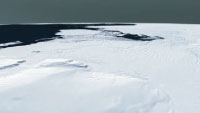
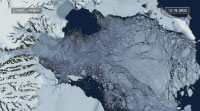
Grade level: 9-12 Themes: climate, ocean circulation, water cycle Video: melting_ice_02.flv
Lora Koenig: "What we're seeing right now on the ice sheets and glaciers is that they are shrinking in size. And as glaciers on land are shrinking overall, that contributes a little bit to sea level rise. And we are worried that as we see warming over the ice sheets, and increased melting over the ice sheets, that they are going to start contributing much more to sea level rise." (source) | |||||||||||||||
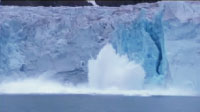
Grade level: 9-12 Themes: climate, ocean circulation, water cycle Video: melting_ice_04.flv
Josh Willis: "As the great ice sheets in Antarctica and Greenland begin to melt and break up due to global warming, we really might experience very rapid sea level rise; three or four times as fast as the rate that we see today. So predicting this rate out into the future is very tricky because we really don't know when the ice sheets might break up and how fast they will when they do. So predicting future sea level rise is one of the great scientific problems of the future." (source) | |||||||||||||||
Grade level: 9-12 Themes: climate, ocean circulation, water cycle Video: melting_ice_01.flv
Josh Willis: "I prefer not to think about climate change and global warming in terms of doom and gloom scenarios, so much as a change in our planet. Our planet's definitely changing, and we're definitely causing it. So we're going to have learn to deal with some of these changes. But in addition, we're going to have to learn how to make a slightly smaller footprint on our planet." Josh Willis: "Sea level is rising effectively because of global warming. As the planet heats up, two things happen to the ocean. One is that the temperature of the water increases. And as that happens, the water actually expands and takes up more room. The other thing that happens is that ice that was on land in the form of glaciers and ice sheets begins to melt and as that runs off into the ocean, it increases the water in the ocean, and it actually raises sea level as well. (source) | |||||||||||||||
Grade level: K-4 Theme: water cycle Activity: http://aquarius.nasa.gov/prop_fresh_sea.html Big Idea Water has unique properties. About 97 percent of all water is in the oceans. Salt water or seawater has characteristics similar to fresh water with some noticeable differences because of the salts that are dissolved in water.
Key Concepts Life on Earth is possible because of water's unique properties.
Water is the only natural substance that is found in all three states -- liquid, solid (ice), and gas (steam) -- at the temperatures normally found on Earth.
Water can absorb a tremendous amount of heat acting like a heat buffer for the Earth.
Background Liquid water (H2O) is often perceived to be pretty ordinary as it is transparent, odorless, tasteless and ubiquitous. Water is unique in that it is the only natural substance that is found in all three states -- liquid, solid (ice), and gas (steam) - at the temperatures normally found on Earth. Earth's water is constantly interacting, changing, and in movement. Water freezes at 32° Fahrenheit (F) and boils at 212° F (at sea level). In fact, water's freezing and boiling points are the baseline with which temperature is measured: 0° on the Celsius scale is water's freezing point, and 100° is water's boiling point. Water is unusual in that the solid form, ice, is less dense than the liquid form, which is why ice floats. | |||||||||||||||
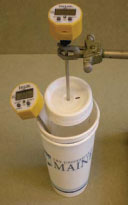
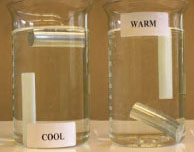
Grade level: 9-12 Theme: water cycle Activity: http://www.tos.org/hands-on/teaching_phys_concepts.pdf
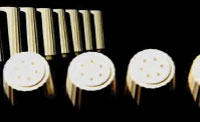
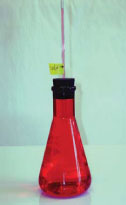
Thermal expansion is the principle by which a liquid thermometer works. In the ocean, thermal expansion is thought to contribute significantly to sea level rise on decadal-to-century-long time scales. However, thermal effects appear to be influenced by decadal climate-related fluctuations, making it difficult to estimate the long-term contribution of thermal expansion to sea level rise. Current estimates suggest that thermal expansion is responsible for 25 percent to 50 perccent of observed sea level rise. In this activity, we look at thermal expansion using two rods, one made of aluminum and the other made of PVC. When placed in cold water, both rods initially float because their densities are lower than that of the cold water. Over time, the PVC rod gets colder and contracts, which results in a density change. When the density of the rod exceeds that of the water, the PVC sinks. The aluminum rod gets colder too, but aluminum expands and contracts much less than PVC when its temperature is changed by the same amount; therefore, the aluminum rod's density is less affected by the temperature change, and it remains floating. Students will also try this experiment with hot water. Videos
Flash Video | QuickTime Movie | |||||||||||||||
Grade level: 9-12 Theme: water cycle Article: documents/21.1_schmitt.pdf Articles in this salinity-themed Oceanography issue articulate the potential of our rapidly expanding ability to measure salinity to enhance understanding of the global water cycle. Read and discuss the first three sections (p. 12-15) of this article. | |||||||||||||||
Grade level: 9-12 Theme: water cycle Video: salt_of_earth_04.flv
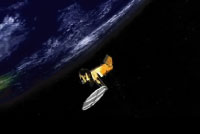
Susan Lozier: "Up until now when we've been trying to understand how density changes impact ocean circulation, we've really just had half the picture." When the Aquarius / SAC-D satellite is launched, scientists can look at salinity of the surface of the ocean from 400 miles above the earth. Susan Lozier: "But now with the Aquarius mission, we'll be able to complete that other half. We'll be able to look at the salinity information. And so salinity, combined with temperature, will give us the information about the density field." The satellite will gather more salinity data than in the last 125 years. This mission will help scientists better understand how salinity and ocean circulation are tied to global climate and how both systems are changing throughout time. (source) | |||||||||||||||
Grade levels: 5-8, 9-12 Themes: climate, ocean circulation, water cycle Video: salt_of_earth_03.flv
Jeff Halverson: "Climate change on earth is complicated by the fact that the ocean moves much more slowly than the atmosphere. So you have warming in the atmosphere, warming in the ocean, but they're occurring at different speeds. So they're out of sync, and that makes predicting what's going to happen in the next hundred or two years very, very difficult." Susan Lozier: "Now what we might expect happens, in a very simplistic sense, is that as the ocean warms, there's going to be more evaporation. And that more evaporation would would mean that oceans become saltier. But really it's not just that simple because there's also evaporation, precipitation, and the ice as well, and that's all wrapped up in the study of the hydrologic cycle." (source) | |||||||||||||||
Grade levels: 5-8, 9-12 Themes: climate, ocean circulation, water cycle Video: salt_of_earth_02.flv
Jeff Halverson: "It takes perhaps a thousand years for the water to cycle through the deep ocean. So we say the oceans have a memory. They're like a tape recorder. Things that happen now will still be manifest hundreds of years in the future as that cold water moves through this giant circulation." Susan Lozier: "So if there's any change to that overturning circulation, that means that Northern Europe and the British Isles would be robbed of that heat due to those waters that are returning to the high latitudes." (source) | |||||||||||||||
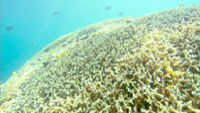
Grade levels: 5-8, 9-12 Themes: ocean circulation, water cycle Video: salt_of_earth_01.flv
It's these differences in salinity that play a role in the processes that affect weather, climate, sea life, and the whole ocean system itself. And not all oceans have the same salinity. In fact, the North Atlantic Ocean tends to be the saltiest, much more than the Pacific. Susan Lozier: "The salt in the ocean affects its density, just like the temperature affects its density, and the density, meaning the amount mass per volume, is going to then impact where the water goes as it circulates throughout the globe." Jeff Halverson: "Differences in temperature and salt content of the water cause some areas of water to sink and some areas of water to rise. And so we tend to see the sinking water at the poles, the water rising back up at the equator, and if you connect the two together, what you have is an overturning that is deep in the ocean. It's like a big conveyor belt that operates in the ocean." This overturning moves warm water from the tropics toward the poles, and cold water from the poles toward the tropics. In this way the overturning regulates earth's climate. (source) | |||||||||||||||
Grade levels: 5-8, 9-12 Themes: ocean circulation, water cycle Video: density_reverse_direction.flv
| |||||||||||||||
Grade level: 9-12 Theme: water cycle Video: Aerosol_Sources_Full_Seq_640x360.flv
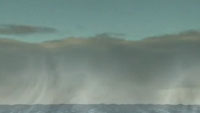
Aerosols can occur in nature, but they can also originate from human activity. This animation provides an introduction to four of the varied sources of atmospheric aerosols: cities, forest fires, the ocean, and deserts. This animation shows the different sources of aerosols, how they mix in the Earths atmosphere, and finally disappear by creating sediment or raining out. Of particular interest is the role of the oceans: salts from the sea spray serve as condensation nuclei. In this animation, sea salt spray aerosols rise into the sky, follows the path downwards to the source (the ocean), and back up into the sky where the aerosols gather in a cloud. (source) | |||||||||||||||
Grade levels: 5-8, 9-12 Themes: 21st century technology, climate, ocean circulation, water cycle Flat Tool: http://ourocean.jpl.nasa.gov/AQUARIUS/chp1.jsp GoogleEarth Interface Tool: http://aquarius.jpl.nasa.gov/AQUARIUS_DEV/chp1.jsp Interactive maps of surface conditions can be clicked to create in-water profiles of salinity, temperature, or density. Sources include interpolated atlas data or actual measurements from the database. Focus Questions | Flat Tool Tutorial | |||||||||||||||
Grade levels: K-4, 5-8, 9-12 Themes: ocean circulation, water cycle Video: water_cycle_ipod_640x480.m4v.flv
Clouds can move great distances and eventually the water molecule will fall as rain or snow. Ultimately, the water molecule arrives back where it started...at the ocean. (source) | |||||||||||||||
Grade level: 5-8 Theme: water cycle Activity: http://www.tos.org/hands-on/teaching_phys_concepts.pdf
Most substances expand when heated and contract when cooled. As the temperature of most substances increases, their molecules vibrate faster and move farther apart, occupying a larger space. When these substances are cooled, their molecules vibrate slower and remain closer to each other. Note that freshwater below 4°C actually expands when cooled, a phenomena known as the anomaly of water. Thermal expansion is the principle by which a liquid thermometer works. In the ocean, thermal expansion is thought to contribute significantly to sea level rise on decadal-to-century-long time scales. However, thermal effects appear to be influenced by decadal climaterelated fluctuations, making it difficult to estimate the long-term contribution of thermal expansion to sea level rise. Current estimates suggest that thermal expansion is responsible for 25 percent to 50 percent of observed sea level rise. In this activity, we look at thermal expansion and attempt to predict what will happen to the ocean's volume if ocean waters become warmer. | |||||||||||||||
Grade levels: K-4, 9-12 Themes: ocean circulation, water cycle Video: water_everywhere_02.flv
Condensation is the process by which water vapor molecules cool, stick together, and become liquid again in cloud formation. This often happens high in the atmosphere where the temperature is much lower than it is near the surface. Paula Bontempi: "What happens in the atmosphere is, just like we have currents in the ocean, we have winds in the atmosphere that actually, to some extent, drive what goes on in the ocean currents. Materials in the atmosphere can travel a great distance, sometimes a quarter of a way around the world, just until they get to the point where they actually turn into rain or snow and thereby fall back to the ocean or fall back to the land. This is called precipitation. If the water molecule falls on the land as snow, it may be stored for a very long period of time in a polar ice sheet or mountain glacier, depending on climate conditions." Matt Rodell: "When rain falls or the snow melts, typically the next place it goes, it infiltrates the soil. So soil is not solid. It's not like a rock, there are pore spaces that can be filled with water and typically there is a certain amount of water in the soil at all times. If soil was completely dry, plants wouldn't be able to grow." (source) | |||||||||||||||
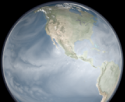
Grade levels: K-4, 9-12 Themes: ocean circulation, water cycle Video: WC_precipitation_IPOD.m4v.flv
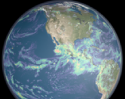
Water regulates climate, storing heat during the day and releasing it at night. Water in the ocean and atmosphere carry heat from the tropics to the poles. The process by which water moves around the earth, from the ocean, to the atmosphere, to the land and back to the ocean is called the water cycle. This animation was created using data from the GEOS-5 atmospheric model on the cubed-sphere, run at 14-km global resolution for 30-days. Variables animated here include evaporation, water vapor and precipitation. This animation is time synchronous throughout the animation to allow cross fades during compositing. (source) | |||||||||||||||
Grade level: 9-12 Theme: water cycle Video: water_everywhere_03.flv
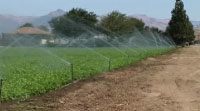
Matt Rodell: "An aquifer is any underground geologic formation that stores water so it's typically either rock with a lot of cracks in it, or it's (a) sandy layer. Sand has a lot of pore space in it and can store a lot of water." A water molecule might remain in an aquifer for more than a million years. More likely, it would help to replenish a stream, which would feed into lakes and rivers. Eventually, the water molecule will return to where it started: the ocean. People also have a role in the water cycle. By pumping water out of the ground for irrigation, cutting down forests for development and building roads and other concrete surfaces that lead to runoff, people can have a serious impact on the path a water molecule takes. Matt Rodell: "The most obvious way that people affect the water cycle are the ways that we control the water after it's fallen on the land surface as rain or melts as snow... But we have put in dams and rivers to hold this water. We've also pumped the groundwater out and used that. So it's these water resources, as we call them, are really us taking a natural part of the water cycle and using it to our benefit." | |||||||||||||||
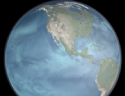
Grade levels: K-4, 5-8, 9-12 Themes: ocean circulation, water cycle Video: water_everywhere_01.flv
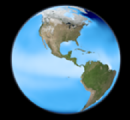
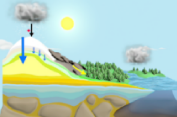
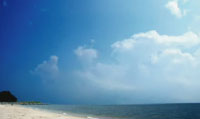
Let's follow a single molecule of water, beginning in the ocean, through the paths it might take before eventually winding up right where it started - back in the big blue sea. The fuel for this journey will be provided by our planet's prime energy source: the sun. During the day, the sun heats up the air and ocean surface, causing water molecules to evaporate. Evaporation occurs when a liquid molecule of water escapes into the air as a gas. This scientific visualization shows how water evaporation, indicated in turquoise, is driven by the energy of the sun. Notice how the rate of evaporation pulses over land: it speeds up during the day and almost disappears at night. Over the ocean, evaporation appears to remain constant, both day and night. Water in the air in gas form is known as water vapor. The molecule is now fresh water, having left the ocean salt and other particles behind. (source) | |||||||||||||||
Grade levels: K-4, 5-8, 9-12 Themes: ocean circulation, water cycle Video: Evap_and_clock_IPOD.m4v.flv
Water regulates climate, storing heat during the day and releasing it at night. Water in the ocean and atmosphere carry heat from the tropics to the poles. The process by which water moves around the earth, from the ocean, to the atmosphere, to the land and back to the ocean is called the water cycle. This animation was created using data from the GEOS-5 atmospheric model on the cubed-sphere, run at 14-km global resolution for 30-days. Variables animated here include evaporation, water vapor and precipitation. This animation is time synchronous throughout the animation to allow cross fades during compositing. (source) | |||||||||||||||
Grade levels: K-4, 5-8, 9-12 Themes: ocean circulation, water cycle Video: WC_evaporation_IPOD.m4v.flv
Water regulates climate, storing heat during the day and releasing it at night. Water in the ocean and atmosphere carry heat from the tropics to the poles. The process by which water moves around the earth, from the ocean, to the atmosphere, to the land and back to the ocean is called the water cycle. This animation was created using data from the GEOS-5 atmospheric model on the cubed-sphere, run at 14-km global resolution for 30-days. Variables animated here include evaporation, water vapor and precipitation. This animation is time synchronous throughout the animation to allow cross fades during compositing. (source) | |||||||||||||||
Grade levels: K-4, 5-8, 9-12 Themes: ocean circulation, water cycle Video: WC_vapor_IPOD.m4v.flv
Water regulates climate, storing heat during the day and releasing it at night. Water in the ocean and atmosphere carry heat from the tropics to the poles. The process by which water moves around the earth, from the ocean, to the atmosphere, to the land and back to the ocean is called the water cycle. This animation was created using data from the GEOS-5 atmospheric model on the cubed-sphere, run at 14-km global resolution for 30-days. Variables animated here include evaporation, water vapor and precipitation. This animation is time synchronous throughout the animation to allow cross fades during compositing. (source) | |||||||||||||||
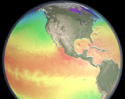
Grade levels: K-4, 5-8, 9-12 Themes: ocean circulation, water cycle Video: WC_SST_IPOD.m4v.flv
Water regulates climate, storing heat during the day and releasing it at night. Water in the ocean and atmosphere carry heat from the tropics to the poles. The process by which water moves around the earth, from the ocean, to the atmosphere, to the land and back to the ocean is called the water cycle. Data for this animation was derived from a model run of ECCO's Ocean General Circulation Model of heat along the ocean's surface. (source) | |||||||||||||||
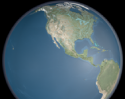
Grade levels: K-4, 5-8, 9-12 Themes: ocean circulation, water cycle Video: WC_rivers_IPOD.m4v.flv
Water regulates climate, storing heat during the day and releasing it at night. Water in the ocean and atmosphere carry heat from the tropics to the poles. The process by which water moves around the earth, from the ocean, to the atmosphere, to the land and back to the ocean is called the water cycle. (source) | |||||||||||||||
Grade level: 9-12 Theme: water cycle Video: water_everywhere_04.flv
Matt Rodell: "The water cycle is one of the ways that we will really feel any changes in climate. So climate changes will feed back to water cycle changes, things like how much precipitation an area receives, the frequency of droughts and floods and this sort of thing." The water cycle is the adventurous journey that water takes through the oceans, atmosphere, and land, driven by the sun. Improving our understanding of the water cycle and how it is changing will be critical for future decisions related to water management, agriculture, natural resources, and climate change. | |||||||||||||||