COSEE-Ocean Systems offers tools and methodologies, such as concept mapping, that promote effective learning in an ocean science
context. Concept mapping is well suited for understanding parts of a complex discipline, such as oceanography. The value of
concept mapping lies in both the process of construction and in the final product, the map - a visualization of the journey to
understanding.
For scientists, concept mapping helps them share their understanding of connections in the earth system. For educators, concept
maps can be powerful tools for exposing and clarifying topics in the classroom. In the North Atlantic Bloom (NAB) webinar series,
each presenter made a concept map with attached assets (videos, images, news items, and resources) to use as the basis for their
online presentation.
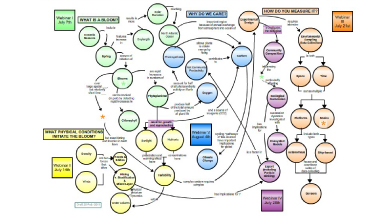
The NAB Experiment was designed to study one of the major oceanographic events on the planet: the subpolar
North Atlantic spring bloom. In her concept map at right, Mary Jane introduces the
photosynthetic organisms responsible for the bloom - genetically diverse phytoplankton that
produce the food for the rest of the food web, absorb carbon dioxide (CO2) and impact the CO2
budget of the atmosphere - and summarizes the new tools and methods used to collect and measure
phytoplankton growth during this experiment.
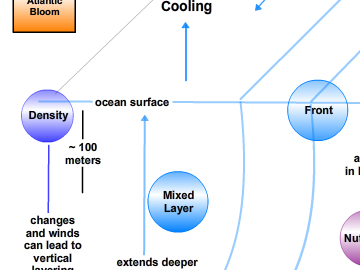
Phytoplankton need nutrients and sunlight to grow. With the coming of spring, solar insolation
increases and the mixed layer shallows, allowing for an increase in phytoplankton growth. In
her concept map, Amala Mahadevan explains how modeling has helped researchers to
better comprehend the physical dynamics behind what triggers the spring bloom.
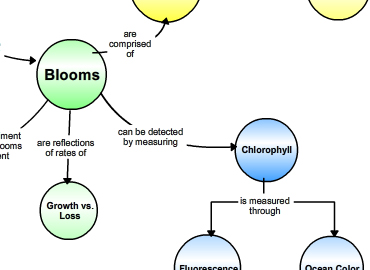
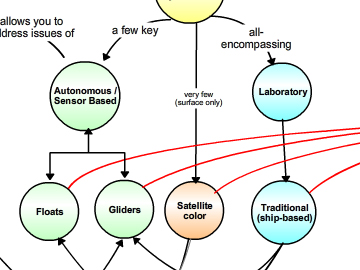
Measuring a bloom poses fundamental challenges because it changes in time as well as space.
Here, Eric D'Asaro presents his perspective on how it's possible to measure a moving,
changing swatch of ocean at different scales, and the technology needed to collect
meaningful data.
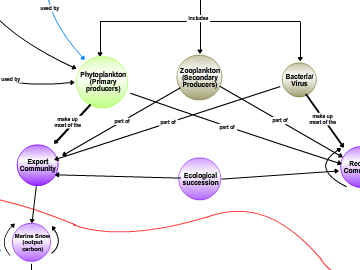
Understanding the change in phytoplankton community composition and the interactions that
occur within that community tells us a lot about the efficiency of carbon transfer in the
water column. It also provides input for ecological models that are used to predict the impact
of climate change on phytoplankton production and circulation. Here, Nicole Poulton and Ivona
Cetinic describe the ecological succession that happens during a phytoplankton bloom, and the
consequences for the marine food web and export of carbon.
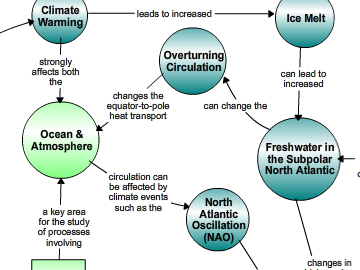
Craig Lee steps back a bit to place the NAB experiment in the context of large-scale
climate changes, with a discussion of the physics, biogeochemistry, and biology of the
ecosystem. In his concept map, he outlines the big picture: what understanding the dynamics
of the spring bloom will mean for scientists concerned about carbon and climate.