| NASA | GSFC | JPL | Site Map |
|
||
 |
 |
Education: Student Outcomes |
Filtered by grade level: 5-8 Click here to begin a new search | |||||||||||||||
Grade levels: 5-8, 9-12 Theme: water cycle Tool: http://aquarius.nasa.gov/education-datatools.html
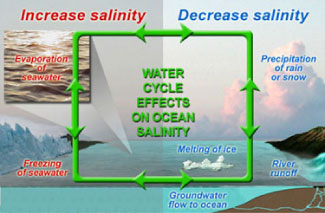
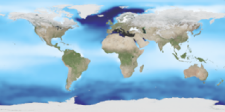
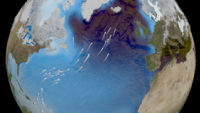
Salinity patterns are governed by geographic differences in the "water budget." For example, like on continents, some areas of the ocean are rainy whereas others are arid and "desert-like." To learn more about the factors that influence salinity patterns, we invite you investigate five pairs of data maps centered over the North Atlantic Ocean (listed below). Each map shows monthly conditions based on long-term averages. The challenge is to find the data set that most closely corresponds to sea surface salinity patterns. Grade level 5-8: Look at monthly maps of: air temperature vs. sea surface salinity and precipitation vs. sea surface salinity. Are any of these data sets closely correlated with solar energy input (e.g., seasonal change)? Grade level 9-12: For the North Atlantic Ocean, look at monthly maps of air temperature vs. sea surface salinity and precipitation vs. sea surface salinity and evaporation vs. sea surface salinity. Are changes in these data sets closely correlated with solar energy input (e.g., seasonal change) in the North Atlantic ocean? Look at these videos -- Sea Surface Salinity and Components of the Water Cycle for global data sets of sea surface temperature, precipitation, and evaporation. | |||||||||||||||
Grade levels: K-4, 5-8, 9-12 Themes: 21st century technology, ocean circulation, water cycle Flat Tool: http://ourocean.jpl.nasa.gov/AQUARIUS/chp2.jsp GoogleEarth Interface Tool: http://aquarius.jpl.nasa.gov/AQUARIUS_DEV/chp2.jsp Create global maps of mean conditions for any month at designated depths (down to 1500m) using the pull-down menus. Monthly time-series graphs of salinity, temperature, or density can be plotted by selecting up to six locations (by clicking on the map or typing latitude/latitude information into the fields below). These time-series graphs can also represent up to six different depths. Plotted data will also be shown in a table that is easily downloaded (e.g., into Excel). Sources include interpolated atlas data or actual measurements from the database. Focus Questions | Flat Tool Tutorial | |||||||||||||||
Grade levels: 5-8, 9-12 Themes: 21st century technology, climate, water cycle Flat Tool: http://ourocean.jpl.nasa.gov/AQUARIUS/chp3.jsp GoogleEarth Interface Tool: http://aquarius.jpl.nasa.gov/AQUARIUS_DEV/chp3.jsp Create global maps of mean conditions for any year(s) from 1800 to 2005 at designated depths (down to 1500m) using the pull-down menus. Annual time-series graphs of salinity, temperature, or density can be plotted by selecting up to six locations (by clicking on the map or typing latitude/latitude information into the fields below). These time-series graphs can also represent up to six different depths. Plotted data will also be shown in a table that is easily downloaded (e.g., into Excel). Source is actual, non-interpolated database measurements. Focus Questions | Flat Tool Tutorial | |||||||||||||||
Grade levels: 5-8, 9-12 Themes: climate, ocean circulation Activity: http://www.tos.org/hands-on/teaching_phys_concepts.pdf
The purpose of this activity is to review basic concepts of thermal physics and highlight applications to ocean processes by focusing on the concept of convection. Convection and advection are the major modes of heat transfer in the ocean and atmosphere. Convection occurs only in fluids and involves vertical motion of fluid, or flow, rather than interactions at the molecular level. It results from differences in densities - hence buoyancy - of fluids. Examples of convective processes include: currents in Earth's mantle, which drive the tectonic system and result from heating and cooling of magma; atmospheric circulation resulting from uneven solar heating (e.g., between the poles and the equator); the global ocean conveyor belt and formation of deep water masses, resulting from cooling of surface water at high latitudes; and vertical mixing in the ocean's upper layer due to variations in heating between day and night. Advection usually refers to horizontal transfer of heat with the flow of water (e.g., the Gulf Stream). Read the following sections of Chapter 4 (Heat and Temperature) in preparation for this activity: • Background (p. 32) • Mechanisms of Heat Transfer (p. 33) Videos
Flash Video | QuickTime Movie
| |||||||||||||||
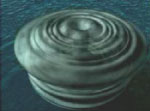
Grade levels: 5-8, 9-12 Theme: ocean circulation Video: density_effects.flv
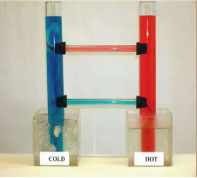
But in the ocean it often happens that the reverse happens: so we might get something that's heavy, heavier (like) more dense waters on top of lighter water. And when that happens, we say that the ocean is unstable and we have "overturning". That means that the waters that are heavy come down to the bottom part of the ocean and those that are light need to go up. And that happens when waters are cooled and it also happens when the upper waters get saltier because of evaporation, etc. So those density differences mean that the ocean is going to circulate: it's going to move. And those density differences can come about because of temperature changes or salinity changes. | |||||||||||||||
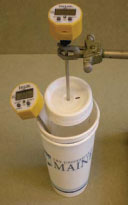
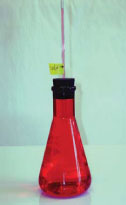
Grade level: 5-8 Theme: ocean circulation Activity: http://aquarius.nasa.gov/seawater_mix_sink.html Big Idea Two of the most important characteristics of ocean water are its temperature and salinity. Together they help govern the density of seawater, which is a major factor controlling the ocean's vertical movements and layered circulation. Key Concepts Sea water has characteristic properties (e.g. density) that are independent of sample size.
There are two main factors that make ocean water more or less dense: temperature and salinity.
Cold, salty water is denser than warm, fresher water and will sink below the less dense layer.
Density is defined as the measure of a material's mass (e.g. grams) divided by its volume (e.g. milliliters).
Mixing of seawater influences the density of seawater thereby affecting ocean circulation. Seawater mixing also has an effect on ocean life.
Background Density is weight divided by volume. The density of fresh water is 1 gram (mass) per cubic centimeter (volume). In other words, if you had a cube with the dimensions: 1cm x 1cm x 1cm; and filled it with pure water, that cube of water would weigh 1 gram. This density is expressed as 1 g/cm3. If you dissolve salt into the water, the salt will increase the fluid's mass, while its volume will remain the same. Thus, the liquid's density will increase. (more) | |||||||||||||||
Grade level: 5-8 Theme: 21st century technology Design your own experiment based on the activities conducted for the following outcomes:
| |||||||||||||||
Grade levels: 5-8, 9-12 Theme: ocean circulation Activity: http://www.tos.org/hands-on/teaching_phys_concepts.pdf
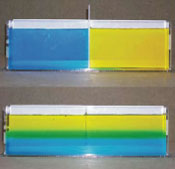
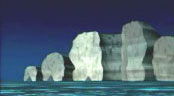
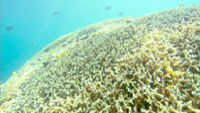
Stratification forms an effective barrier for the exchange of nutrients and dissolved gases between the top, illuminated surface layer where phytoplankton can thrive, and the deep, nutrientrich waters. Stratification therefore has important implications for biological and biogeochemical processes in the ocean. For example, periods of increased ocean stratification have been associated with decreases in surface phytoplankton biomass. In coastal waters, prolonged periods of stratification can lead to hypoxia (low oxygen), causing mortality of fish, crabs, and other marine organisms. This activity compares salt and fresh water, demonstrating that fluids arrange into layers according to their densities. Students in grades 9-12 should read the Background section (p. 4-5) of Chapter 1 (Density) in preparation for this activity. Videos
Flash Video | QuickTime Movie | |||||||||||||||
Grade levels: 5-8, 9-12 Theme: ocean circulation Activity: http://www.tos.org/hands-on/teaching_phys_concepts.pdf
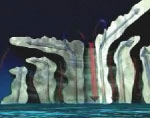
Stratification forms an effective barrier for the exchange of nutrients and dissolved gases between the top, illuminated surface layer where phytoplankton can thrive, and the deep, nutrientrich waters. Stratification therefore has important implications for biological and biogeochemical processes in the ocean. For example, periods of increased ocean stratification have been associated with decreases in surface phytoplankton biomass. In coastal waters, prolonged periods of stratification can lead to hypoxia (low oxygen), causing mortality of fish, crabs, and other marine organisms. This activity compares warm and cold water, demonstrating that fluids arrange into layers according to their densities. Students in grades 9-12 should read the Background section (p. 4-5) of Chapter 1 (Density) in preparation for this activity. Videos
Flash Video | QuickTime Movie | |||||||||||||||
Grade level: 5-8 Theme: climate Video: atmosphere_ocean_fluids.flv Currently we have a 50 degree Fahrenheit difference between the temperatures around the equator and the temperatures at the high latitudes near the poles. So that's 50 degrees Fahrenheit difference. Now without those fluids - so if the earth didn't have an atmosphere and the earth didn't have an ocean (which might not make it very livable) - but if we just had a solid land planet, that temperature difference would be 200 degrees Fahrenheit. So it really gives you an idea of how much work those fluids are doing and how much heat they're delivering from the equator to the poles. | |||||||||||||||
Grade level: 5-8 Theme: water cycle Activity: http://www.tos.org/hands-on/teaching_phys_concepts.pdf
When an object gains heat, two things can happen: the temperature of the object can rise, or the object can change its state without a measurable change in temperature (e.g., ice melting into water). Most materials have two state transitions: from solid to liquid and from liquid to gas. The heat needed to change the state of a material is called latent heat of fusion (for changing from solid to liquid) and latent heat of vaporization (for changing from liquid to gas). Latent heats of fusion and vaporization for water are high and have many important consequences for Earth's climate. Videos
Flash Video | QuickTime Movie | |||||||||||||||
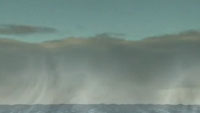
Grade level: 5-8 Theme: water cycle Video: hurricane_cloud_growth.flv
NASA's Tropical Rainfall Measuring Mission (TRMM) provides a closer look at hurricanes using a unique combination of passive and active microwave instruments designed to peer inside cloud systems and measure rainfall. TRMM allows scientists to study the combustion process in the hurricane engine and relate this process to intensification or weakening. (source) | |||||||||||||||
Grade level: 5-8 Theme: water cycle Video: hurricane_latent_heat.flv
NASA's Tropical Rainfall Measuring Mission (TRMM) provides a closer look at hurricanes using a unique combination of passive and active microwave instruments designed to peer inside cloud systems and measure rainfall. TRMM allows scientists to study the combustion process in the hurricane engine and relate this process to intensification or weakening. (source) | |||||||||||||||
Grade level: 5-8 Theme: water cycle Video: hurricane_heat_engine.flv
The release of latent heat warms the surrounding air, making it lighter, which promotes updrafts (shown as blue arrows) and vigorous cloud development. Red arrows show areas of low atmospheric pressure. It is suspected that rapid bursts of cloud growth, particularly in the eyewall region of hurricanes, may relate to the intensification phase of a storm. (source) Read Prerequisite Knowledge (p. 2-4). | |||||||||||||||
Grade level: 5-8 Theme: ocean circulation Video: salinity_importance.flv The salt in the ocean affects its density, just like the temperature affects its density. And the density, meaning the amount of mass per volume, is going to then impact how the ocean circulates, it's going to impact where the water goes as it circulates throughout the globe. | |||||||||||||||
Grade level: 5-8 Theme: water cycle Activity: http://www.nasa.gov/pdf/62319main_ICS_Energy.pdf
Read the section on Prerequisite Knowledge (p. 2-4). | |||||||||||||||
Grade levels: 5-8, 9-12 Themes: climate, ocean circulation Tool: http://oceanmotion.org/html/resources/oscar.htm This data visualizer gives access to the following global ocean surface current behaviors between 1992 and 2008: current speed, current direction, current convergence, and current vorticity as well as the anomaly values for each. | |||||||||||||||
Grade level: 5-8 Theme: climate Tool: http://oceanmotion.org/html/resources/winds.htm This data visualizer includes wind speeds and directions from 1999 to 2008. | |||||||||||||||
Grade level: 5-8 Theme: climate Video: salinity_and_climate_2.flv One of the concerns we've had is whether or not the salinity changes will impact what's called the very large-scale ocean overturning circulation, what many people refer to as "the global ocean conveyer belt". And so that overturning of the ocean plays a large role in our climate. And not just (sort of) a climate that we think of in a really abstract sense but it really means a lot for the climate that we live in because that ocean overturning redistributes the heat. | |||||||||||||||
Grade level: 5-8 Theme: climate Video: salinity_and_climate_1.flv
So these warm waters are returning at the surface, going back to those high latitudes in the Norwegian and Greenland seas. And when they're doing that, when they're returning, they're bringing very warm water with them. Because that return means they're coming through the equatorial regions of the tropics where the atmosphere is very warm and the oceans are warmed. So when those warm waters are returning, as they're moving up to the higher and higher latitudes, then they're releasing that heat to the atmosphere. Then the winds blow over the ocean, they pick up that heat, and those winds over the Atlantic Ocean are moving from the North American continent to the European continent. So these westerly winds are picking up that heat and moisture and dumping it all over the British Isles and northern Europe. So if there's any change to that overturning circulation, that means that northern Europe and the British Isles would be robbed of that heat, due to those waters that are returning to the high latitudes. | |||||||||||||||
Grade levels: 5-8, 9-12 Themes: climate, ocean circulation, water cycle Video: salt_of_earth_03.flv
Jeff Halverson: "Climate change on earth is complicated by the fact that the ocean moves much more slowly than the atmosphere. So you have warming in the atmosphere, warming in the ocean, but they're occurring at different speeds. So they're out of sync, and that makes predicting what's going to happen in the next hundred or two years very, very difficult." Susan Lozier: "Now what we might expect happens, in a very simplistic sense, is that as the ocean warms, there's going to be more evaporation. And that more evaporation would would mean that oceans become saltier. But really it's not just that simple because there's also evaporation, precipitation, and the ice as well, and that's all wrapped up in the study of the hydrologic cycle." (source) | |||||||||||||||
Grade levels: 5-8, 9-12 Themes: climate, ocean circulation, water cycle Video: salt_of_earth_02.flv
Jeff Halverson: "It takes perhaps a thousand years for the water to cycle through the deep ocean. So we say the oceans have a memory. They're like a tape recorder. Things that happen now will still be manifest hundreds of years in the future as that cold water moves through this giant circulation." Susan Lozier: "So if there's any change to that overturning circulation, that means that Northern Europe and the British Isles would be robbed of that heat due to those waters that are returning to the high latitudes." (source) | |||||||||||||||
Grade levels: 5-8, 9-12 Themes: ocean circulation, water cycle Video: salt_of_earth_01.flv
It's these differences in salinity that play a role in the processes that affect weather, climate, sea life, and the whole ocean system itself. And not all oceans have the same salinity. In fact, the North Atlantic Ocean tends to be the saltiest, much more than the Pacific. Susan Lozier: "The salt in the ocean affects its density, just like the temperature affects its density, and the density, meaning the amount mass per volume, is going to then impact where the water goes as it circulates throughout the globe." Jeff Halverson: "Differences in temperature and salt content of the water cause some areas of water to sink and some areas of water to rise. And so we tend to see the sinking water at the poles, the water rising back up at the equator, and if you connect the two together, what you have is an overturning that is deep in the ocean. It's like a big conveyor belt that operates in the ocean." This overturning moves warm water from the tropics toward the poles, and cold water from the poles toward the tropics. In this way the overturning regulates earth's climate. (source) | |||||||||||||||
Grade levels: 5-8, 9-12 Themes: ocean circulation, water cycle Video: density_reverse_direction.flv
| |||||||||||||||
Grade level: 5-8 Theme: ocean circulation Video: sst_reverse_direction.flv
| |||||||||||||||
Grade levels: 5-8, 9-12 Themes: 21st century technology, climate, ocean circulation, water cycle Flat Tool: http://ourocean.jpl.nasa.gov/AQUARIUS/chp1.jsp GoogleEarth Interface Tool: http://aquarius.jpl.nasa.gov/AQUARIUS_DEV/chp1.jsp Interactive maps of surface conditions can be clicked to create in-water profiles of salinity, temperature, or density. Sources include interpolated atlas data or actual measurements from the database. Focus Questions | Flat Tool Tutorial | |||||||||||||||
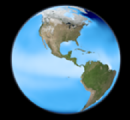
Grade levels: K-4, 5-8, 9-12 Themes: ocean circulation, water cycle Video: water_cycle_ipod_640x480.m4v.flv
Clouds can move great distances and eventually the water molecule will fall as rain or snow. Ultimately, the water molecule arrives back where it started...at the ocean. (source) | |||||||||||||||
Grade level: 5-8 Theme: water cycle Activity: http://www.tos.org/hands-on/teaching_phys_concepts.pdf
Most substances expand when heated and contract when cooled. As the temperature of most substances increases, their molecules vibrate faster and move farther apart, occupying a larger space. When these substances are cooled, their molecules vibrate slower and remain closer to each other. Note that freshwater below 4°C actually expands when cooled, a phenomena known as the anomaly of water. Thermal expansion is the principle by which a liquid thermometer works. In the ocean, thermal expansion is thought to contribute significantly to sea level rise on decadal-to-century-long time scales. However, thermal effects appear to be influenced by decadal climaterelated fluctuations, making it difficult to estimate the long-term contribution of thermal expansion to sea level rise. Current estimates suggest that thermal expansion is responsible for 25 percent to 50 percent of observed sea level rise. In this activity, we look at thermal expansion and attempt to predict what will happen to the ocean's volume if ocean waters become warmer. | |||||||||||||||
Grade levels: 5-8, 9-12 Theme: ocean circulation Video: thermohaline_conveyor_iPod.m4v.flv
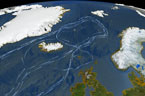
This animation shows one of the major regions where this pumping occurs: the North Atlantic Ocean around Greenland, Iceland, and the North Sea. The surface ocean current brings new water to this region from the South Atlantic via the Gulf Stream and the water returns to the South Atlantic via the North Atlantic Deep Water current. The continual influx of warm water into the North Atlantic polar ocean keeps the regions around Iceland and southern Greenland mostly free of sea ice year round. The animation also shows another feature of the global ocean circulation: the Antarctic Circumpolar Current. The region around latitude 60 degrees south is the the only part of the Earth where the ocean can flow all the way around the world with no land in the way. As a result, both the surface and deep waters flow from west to east around Antarctica. This circumpolar motion links the world's oceans and allows the deep water circulation from the Atlantic to rise in the Indian and Pacific Oceans and the surface circulation to close with the northward flow in the Atlantic. (source) | |||||||||||||||
Grade levels: 5-8, 9-12 Theme: ocean circulation Video: thermohaline_rev.flv
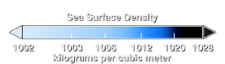
The animation also shows another feature of the global ocean circulation: the Antarctic Circumpolar Current. The region around latitude 60 south is the only part of the Earth where the ocean can flow all the way around the world with no obstruction by land. As a result, both the surface and deep waters flow from west to east around Antarctica. This circumpolar motion links the world's oceans and allows the deep water circulation from the Atlantic to rise in the Indian and Pacific Oceans, thereby closing the surface circulation with the northward flow in the Atlantic. The color on the world's ocean's at the beginning of this animation represents surface water density, with dark regions being most dense and light regions being least dense (see the animation Sea Surface Temperature, Salinity and Density). The depths of the oceans are highly exaggerated (100x in oceans, 20x on land) to better illustrate the differences between the surface flows and deep water flows. The actual flows in this model are based on current theories of the thermohaline circulation rather than actual data. The thermohaline circulation is a very slow moving current that can be difficult to distinguish from general ocean circulation. Therefore, it is difficult to measure or simulate. This version of the visualization combines the Earth look of the original thermohaline visualization with the new thermohaline flow field generated for the Science on a Sphere production, "Loop". (source) | |||||||||||||||
Grade level: 5-8 Theme: climate Activity: documents/vtop_coastal_v_inland_temps.pdf In this activity, students will use the weather section of the newspaper to help discover why coastal regions have relatively moderate climates. They will construct models of the ocean and the land to measure the different cooling and warming rates of each. | |||||||||||||||
Grade level: 5-8 Theme: climate Activity: documents/vtop_global_winds_oc_currents.pdf The surface currents of the major ocean basins show similarities to the prevailing wind systems that drive them. Contained by continental boundaries and deflected by Earth's rotation, these surface currents flow in large, roughly circular patterns called gyres. Gyres play an important role in redistributing heat from the low to middle and high latitudes, thus influencing air temperature, weather, and climate. After completing this investigation, students should be able to (1) demonstrate the influence of wind on ocean currents, and (2) describe the typical gyre circulation of surface currents in two major ocean basins. | |||||||||||||||
Grade level: 5-8 Theme: climate Activity: documents/vtop_oc_currents_coastal_temp.pdf The surface currents of the major ocean basins show similarities to the prevailing wind systems that drive them. Contained by continental boundaries and deflected by Earth's rotation, these surface currents flow in large, roughly circular patterns called gyres. Gyres play an important role in redistributing heat from the low to middle and high latitudes, thus influencing air temperature, weather, and climate. After completing this investigation, students should be able to (1) demonstrate the influence of wind on ocean currents, and (2) describe the typical gyre circulation of surface currents in two major ocean basins. | |||||||||||||||
Grade levels: K-4, 5-8, 9-12 Themes: ocean circulation, water cycle Video: water_everywhere_01.flv
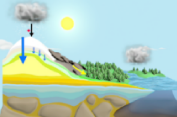
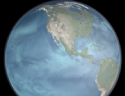
Let's follow a single molecule of water, beginning in the ocean, through the paths it might take before eventually winding up right where it started - back in the big blue sea. The fuel for this journey will be provided by our planet's prime energy source: the sun. During the day, the sun heats up the air and ocean surface, causing water molecules to evaporate. Evaporation occurs when a liquid molecule of water escapes into the air as a gas. This scientific visualization shows how water evaporation, indicated in turquoise, is driven by the energy of the sun. Notice how the rate of evaporation pulses over land: it speeds up during the day and almost disappears at night. Over the ocean, evaporation appears to remain constant, both day and night. Water in the air in gas form is known as water vapor. The molecule is now fresh water, having left the ocean salt and other particles behind. (source) | |||||||||||||||
Grade levels: K-4, 5-8, 9-12 Themes: ocean circulation, water cycle Video: Evap_and_clock_IPOD.m4v.flv
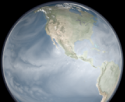
Water regulates climate, storing heat during the day and releasing it at night. Water in the ocean and atmosphere carry heat from the tropics to the poles. The process by which water moves around the earth, from the ocean, to the atmosphere, to the land and back to the ocean is called the water cycle. This animation was created using data from the GEOS-5 atmospheric model on the cubed-sphere, run at 14-km global resolution for 30-days. Variables animated here include evaporation, water vapor and precipitation. This animation is time synchronous throughout the animation to allow cross fades during compositing. (source) | |||||||||||||||
Grade levels: K-4, 5-8, 9-12 Themes: ocean circulation, water cycle Video: WC_evaporation_IPOD.m4v.flv
Water regulates climate, storing heat during the day and releasing it at night. Water in the ocean and atmosphere carry heat from the tropics to the poles. The process by which water moves around the earth, from the ocean, to the atmosphere, to the land and back to the ocean is called the water cycle. This animation was created using data from the GEOS-5 atmospheric model on the cubed-sphere, run at 14-km global resolution for 30-days. Variables animated here include evaporation, water vapor and precipitation. This animation is time synchronous throughout the animation to allow cross fades during compositing. (source) | |||||||||||||||
Grade levels: K-4, 5-8, 9-12 Themes: ocean circulation, water cycle Video: WC_vapor_IPOD.m4v.flv
Water regulates climate, storing heat during the day and releasing it at night. Water in the ocean and atmosphere carry heat from the tropics to the poles. The process by which water moves around the earth, from the ocean, to the atmosphere, to the land and back to the ocean is called the water cycle. This animation was created using data from the GEOS-5 atmospheric model on the cubed-sphere, run at 14-km global resolution for 30-days. Variables animated here include evaporation, water vapor and precipitation. This animation is time synchronous throughout the animation to allow cross fades during compositing. (source) | |||||||||||||||
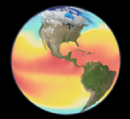
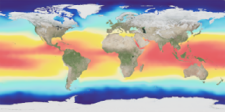
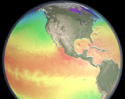
Grade levels: K-4, 5-8, 9-12 Themes: ocean circulation, water cycle Video: WC_SST_IPOD.m4v.flv
Water regulates climate, storing heat during the day and releasing it at night. Water in the ocean and atmosphere carry heat from the tropics to the poles. The process by which water moves around the earth, from the ocean, to the atmosphere, to the land and back to the ocean is called the water cycle. Data for this animation was derived from a model run of ECCO's Ocean General Circulation Model of heat along the ocean's surface. (source) | |||||||||||||||
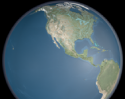
Grade levels: K-4, 5-8, 9-12 Themes: ocean circulation, water cycle Video: WC_rivers_IPOD.m4v.flv
Water regulates climate, storing heat during the day and releasing it at night. Water in the ocean and atmosphere carry heat from the tropics to the poles. The process by which water moves around the earth, from the ocean, to the atmosphere, to the land and back to the ocean is called the water cycle. (source) | |||||||||||||||